Pizza Hut 2013 Annual Report Download - page 163
Download and view the complete annual report
Please find page 163 of the 2013 Pizza Hut annual report below. You can navigate through the pages in the report by either clicking on the pages listed below, or by using the keyword search tool below to find specific information within the annual report.-
 1
1 -
2
-
3
-
4
-
5
-
6
-
7
-
8
-
9
-
10
-
11
-
12
-
13
-
14
-
15
-
16
-
17
-
18
-
19
-
20
-
21
-
22
-
23
-
24
-
25
-
26
-
27
-
28
-
29
-
30
-
31
-
32
-
33
-
34
-
35
-
36
-
37
-
38
-
39
-
40
-
41
-
42
-
43
-
44
-
45
-
46
-
47
-
48
-
49
-
50
-
51
-
52
-
53
-
54
-
55
-
56
-
57
-
58
-
59
-
60
-
61
-
62
-
63
-
64
-
65
-
66
-
67
-
68
-
69
-
70
-
71
-
72
-
73
-
74
-
75
-
76
-
77
-
78
-
79
-
80
-
81
-
82
-
83
-
84
-
85
-
86
-
87
-
88
-
89
-
90
-
91
-
92
-
93
-
94
-
95
-
96
-
97
-
98
-
99
-
100
-
101
-
102
-
103
-
104
-
105
-
106
-
107
-
108
-
109
-
110
-
111
-
112
-
113
-
114
-
115
-
116
-
117
-
118
-
119
-
120
-
121
-
122
-
123
-
124
-
125
-
126
-
127
-
128
-
129
-
130
-
131
-
132
-
133
-
134
-
135
-
136
-
137
-
138
-
139
-
140
-
141
-
142
-
143
-
144
-
145
-
146
-
147
-
148
-
149
-
150
-
151
-
152
-
 153
153 -
 154
154 -
 155
155 -
 156
156 -
 157
157 -
 158
158 -
 159
159 -
 160
160 -
 161
161 -
 162
162 -
 163
163 -
 164
164 -
 165
165 -
 166
166 -
 167
167 -
 168
168 -
 169
169 -
 170
170 -
 171
171 -
 172
172 -
 173
173 -
174
-
175
-
176
-
177
-
178
 |
 |

YUM! BRANDS, INC.-2013 Form10-K 67
Form 10-K
PART II
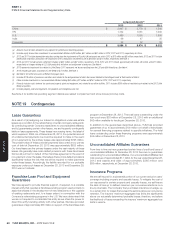
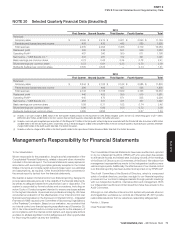
ITEM 8Financial Statements andSupplementaryData
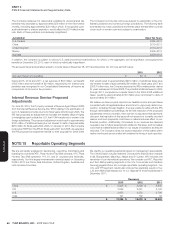
Operating Profit; Interest Expense, Net; and Income
Before Income Taxes
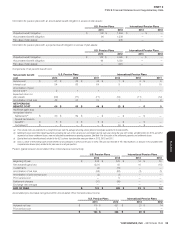
2013 2012 2011
China(b) $ 777 $ 1,015 $ 908
YRI 760 715 673
U.S. 684 666 589
India (15) (1) —
Unallocated Occupancy and other(a)(c) — 16 14
Unallocated and corporate expenses(a)(d) (207) (271) (223)
Unallocated Closures and impairment expense(a)(e) (295) — (80)
Unallocated Other income (expense)(a)(f) (6) 76 6
Unallocated Refranchising gain (loss)(a)(g) 100 78 (72)
Operating Profit 1,798 2,294 1,815
Interest expense, net(h) (247) (149) (156)
INCOME BEFORE INCOME TAXES $ 1,551 $ 2,145 $ 1,659
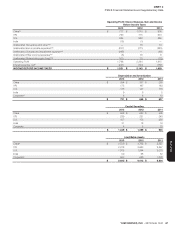
Depreciation and Amortization
2013 2012 2011
China $ 394 $ 337 $ 258
YRI 175 167 183
U.S. 135 147 179
India 9 6 5
Corporate(c) 8 8 12
$ 721 $ 665 $ 637
Capital Spending
2013 2012 2011
China $ 568 $ 655 $ 405
YRI 289 251 240
U.S. 157 173 256
India 31 18 16
Corporate 4 2 23
$ 1,049 $ 1,099 $ 940
Identifiable Assets
2013 2012 2011
China(i) $ 3,720 $ 3,752 $ 2,527
YRI 2,618 2,663 2,847
U.S. 1,705 1,844 2,070
India 99 68 52
Corporate(j) 553 686 1,338
$ 8,695 $ 9,013 $ 8,834