Pizza Hut 2013 Annual Report Download - page 122
Download and view the complete annual report
Please find page 122 of the 2013 Pizza Hut annual report below. You can navigate through the pages in the report by either clicking on the pages listed below, or by using the keyword search tool below to find specific information within the annual report.-
 1
1 -
2
-
3
-
4
-
5
-
6
-
7
-
8
-
9
-
10
-
11
-
12
-
13
-
14
-
15
-
16
-
17
-
18
-
19
-
20
-
21
-
22
-
23
-
24
-
25
-
26
-
27
-
28
-
29
-
30
-
31
-
32
-
33
-
34
-
35
-
36
-
37
-
38
-
39
-
40
-
41
-
42
-
43
-
44
-
45
-
46
-
47
-
48
-
49
-
50
-
51
-
52
-
53
-
54
-
55
-
56
-
57
-
58
-
59
-
60
-
61
-
62
-
63
-
64
-
65
-
66
-
67
-
68
-
69
-
70
-
71
-
72
-
73
-
74
-
75
-
76
-
77
-
78
-
79
-
80
-
81
-
82
-
83
-
84
-
85
-
86
-
87
-
88
-
89
-
90
-
91
-
92
-
93
-
94
-
95
-
96
-
97
-
98
-
99
-
100
-
101
-
102
-
103
-
104
-
105
-
106
-
107
-
108
-
109
-
110
-
111
-
 112
112 -
 113
113 -
 114
114 -
 115
115 -
 116
116 -
 117
117 -
 118
118 -
 119
119 -
 120
120 -
 121
121 -
 122
122 -
 123
123 -
 124
124 -
 125
125 -
 126
126 -
 127
127 -
 128
128 -
 129
129 -
 130
130 -
 131
131 -
 132
132 -
133
-
134
-
135
-
136
-
137
-
138
-
139
-
140
-
141
-
142
-
143
-
144
-
145
-
146
-
147
-
148
-
149
-
150
-
151
-
152
-
153
-
154
-
155
-
156
-
157
-
158
-
159
-
160
-
161
-
162
-
163
-
164
-
165
-
166
-
167
-
168
-
169
-
170
-
171
-
172
-
173
-
174
-
175
-
176
-
177
-
178
 |
 |

YUM! BRANDS, INC.-2013 Form10-K26
Form 10-K
PART II
ITEM7Management’s Discussion and Analysis of Financial Condition and Results of Operations
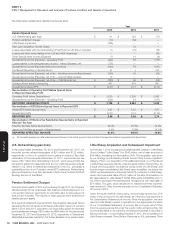
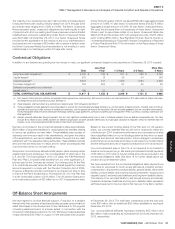
Income/(Expense)
2012 vs. 2011
2011
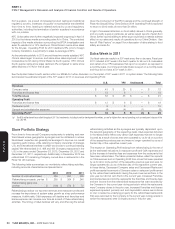
Store Portfolio
Actions Other
53rd Week in
2011 2012
Company sales $ 3,000 $ (535) $ 128 $ (43) $ 2,550
Cost of sales (917) 177 (13) 13 (740)
Cost of labor (912) 165 (16) 12 (751)
Occupancy and other (809) 164 (7) 9 (643)
RESTAURANT PROFIT $ 362 $ (29) $ 92 $ (9) $ 416
Restaurant margin 12.1% 16.3%
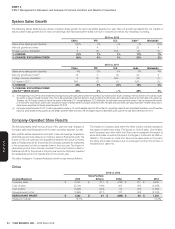
In 2013, the decrease in U.S. Company sales and Restaurant profit
associated with store portfolio actions was driven by refranchising, partially
offset by net new unit development. Significant other factors impacting
Company sales and/or Restaurant profit were higher commodity costs
and promotional activities. Company same-store sales were flat in 2013�
In 2012, the decrease in U�S� Company sales and Restaurant profit
associated with store portfolio actions was primarily driven by refranchising.
Significant other factors impacting Company sales and/or Restaurant
profit were same-store sales growth of 5%, including the positive impact
of less discounting, combined with the positive impact of sales mix shifts
as well as supply chain efficiencies, partially offset by higher restaurant-
level incentive compensation costs.
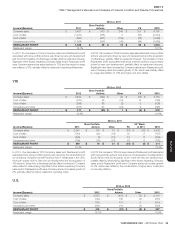
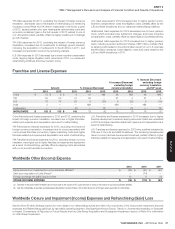
Franchise and License Fees and Income
Amount % Increase (Decrease)
% Increase (Decrease)
excluding foreign
currency translation
% Increase (Decrease)
excluding foreign
currency translation
and 53rd week
2013 2012 2011 2013 2012 2013 2012 2013 2012
China $ 105 $ 101 $ 79 4 29 2 25 2 25
YRI 940 879 851 7 3 10 7 10 8
U.S. 837 802 786 4 2 4 2 4 4
India 18 18 17 — 6 8 18 8 18
WORLDWIDE $ 1,900 $ 1,800 $ 1,733 647677
China Franchise and license fees and income increased 2% in 2013,
excluding the impact of foreign currency translation. The increase was driven
by refranchising and franchise new unit development, partially offset by
franchise same-store sales declines. China Franchise and license fees and
income increased 25% in 2012, excluding the impact of foreign currency
translation. The increase was driven by refranchising, franchise new unit
development and franchise same-store sales growth.
YRI Franchise and license fees and income increased 10% in 2013, excluding
the impact of foreign currency translation. The increase was driven by
franchise net new unit development, franchise same-store sales growth and
refranchising. YRI Franchise and license fees and income increased 8% in
2012, excluding the impact of foreign currency translation and the 53
rd
week
in 2011. The increase was driven by franchise net new unit development
and franchise same-store sales growth.
U.S. Franchise and license fees and income increased 4% in 2013 driven
by refranchising. U.S. Franchise and license fees and income increased
4% in 2012, excluding the 53rd week in 2011. The increase was driven by
refranchising and franchise same-store sales growth, partially offset by the
LJS and A&W divestitures.
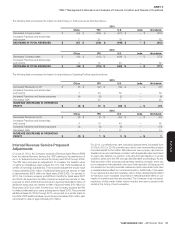
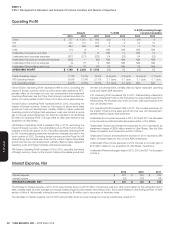
General and Administrative Expenses
Amount % Increase (Decrease)
% Increase (Decrease)
excluding foreign
currency translation
% Increase (Decrease)
excluding foreign
currency translation
and 53rd week
2013 2012 2011 2013 2012 2013 2012 2013 2012
China $ 357 $ 334 $ 275 7 21 5 19 5 19
YRI 394 414 400 (5) 3 (3) 6 (3) 7
U.S. 427 467 450 (9) 4 (9) 4 (9) 5
India 27 24 22 14 9 25 25 25 25
Unallocated 207 271 225 (24) 21 (24) 21 (24) 22
WORLDWIDE $ 1,412 $ 1,510 $ 1,372 (6) 10 (6) 11 (6) 11
China G&A expenses for 2013, excluding the impact of foreign currency
translation, increased due to higher headcount and wage inflation and
additional G&A as a result of consolidating Little Sheep beginning in the
second quarter of 2012, partially offset by lower incentive compensation
costs�
China G&A expenses for 2012, excluding the impact of foreign currency
translation, increased due to higher headcount and wage inflation and
additional G&A as a result of consolidating Little Sheep beginning in the
second quarter of 2012�