Pizza Hut 2013 Annual Report Download - page 113
Download and view the complete annual report
Please find page 113 of the 2013 Pizza Hut annual report below. You can navigate through the pages in the report by either clicking on the pages listed below, or by using the keyword search tool below to find specific information within the annual report.-
 1
1 -
2
-
3
-
4
-
5
-
6
-
7
-
8
-
9
-
10
-
11
-
12
-
13
-
14
-
15
-
16
-
17
-
18
-
19
-
20
-
21
-
22
-
23
-
24
-
25
-
26
-
27
-
28
-
29
-
30
-
31
-
32
-
33
-
34
-
35
-
36
-
37
-
38
-
39
-
40
-
41
-
42
-
43
-
44
-
45
-
46
-
47
-
48
-
49
-
50
-
51
-
52
-
53
-
54
-
55
-
56
-
57
-
58
-
59
-
60
-
61
-
62
-
63
-
64
-
65
-
66
-
67
-
68
-
69
-
70
-
71
-
72
-
73
-
74
-
75
-
76
-
77
-
78
-
79
-
80
-
81
-
82
-
83
-
84
-
85
-
86
-
87
-
88
-
89
-
90
-
91
-
92
-
93
-
94
-
95
-
96
-
97
-
98
-
99
-
100
-
101
-
102
-
 103
103 -
 104
104 -
 105
105 -
 106
106 -
 107
107 -
 108
108 -
 109
109 -
 110
110 -
 111
111 -
 112
112 -
 113
113 -
 114
114 -
 115
115 -
 116
116 -
 117
117 -
 118
118 -
 119
119 -
 120
120 -
 121
121 -
 122
122 -
 123
123 -
124
-
125
-
126
-
127
-
128
-
129
-
130
-
131
-
132
-
133
-
134
-
135
-
136
-
137
-
138
-
139
-
140
-
141
-
142
-
143
-
144
-
145
-
146
-
147
-
148
-
149
-
150
-
151
-
152
-
153
-
154
-
155
-
156
-
157
-
158
-
159
-
160
-
161
-
162
-
163
-
164
-
165
-
166
-
167
-
168
-
169
-
170
-
171
-
172
-
173
-
174
-
175
-
176
-
177
-
178
 |
 |

YUM! BRANDS, INC.-2013 Form10-K 17
Form 10-K
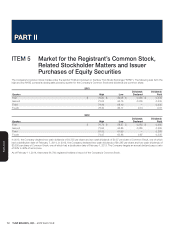
PART II
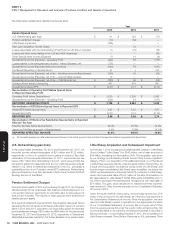
ITEM7Management’s Discussion and Analysis of Financial Condition and Results of Operations
Results of Operations
Amount % B/(W)
2013 2012 2011 2013 2012
Company sales $ 11,184 $ 11,833 $ 10,893 (5) 9
Franchise and license fees and income 1,900 1,800 1,733 6 4
TOTAL REVENUES $ 13,084 $ 13,633 $ 12,626 (4) 8
COMPANY RESTAURANT PROFIT $ 1,683 $ 1,981 $ 1,753 (15) 13
% OF COMPANY SALES 15.0% 16.7% 16.1% (1.7) ppts. 0.6 ppts.
OPERATING PROFIT $ 1,798 $ 2,294 $ 1,815 (22) 26
Interest expense, net 247 149 156 (66) 5
Income tax provision 487 537 324 9 (66)
Net Income – including noncontrolling interests 1,064 1,608 1,335 (34) 20
Net Income (loss) – noncontrolling interests (27) 11 16 NM 35
NET INCOME – YUM! BRANDS, INC. $ 1,091 $ 1,597 $ 1,319 (32) 21
DILUTED EPS(a) $ 2.36 $ 3.38 $ 2.74 (30) 23
DILUTED EPS BEFORE SPECIAL ITEMS(a) $ 2.97 $ 3.25 $ 2.87 (9) 13
REPORTED EFFECTIVE TAX RATE 31.4% 25.0% 19.5%
EFFECTIVE TAX RATE BEFORE SPECIAL ITEMS 28.0% 25.8% 24.2%
(a) See Note 3 for the number of shares used in these calculations.
Significant Known Events, Trends or Uncertainties Impacting or Expected to Impact
Comparisons of Reported or Future Results
Special Items
In addition to the results provided in accordance with U.S. Generally
Accepted Accounting Principles (“GAAP”) above and throughout this
document, the Company has provided non-GAAP measurements which
present operating results in 2013, 2012 and 2011 on a basis before
Special Items.
The Company uses earnings before Special Items as a key performance
measure of results of operations for the purpose of evaluating performance
internally, and Special Items are not included in our China, YRI, U.S. or
India segment results. This non-GAAP measurement is not intended to
replace the presentation of our financial results in accordance with GAAP.
Rather, the Company believes that the presentation of earnings before
Special Items provides additional information to investors to facilitate the
comparison of past and present operations, excluding items in 2013,
2012 and 2011 that the Company does not believe are indicative of our
ongoing operations due to their size and/or nature.