Pizza Hut 2013 Annual Report Download - page 120
Download and view the complete annual report
Please find page 120 of the 2013 Pizza Hut annual report below. You can navigate through the pages in the report by either clicking on the pages listed below, or by using the keyword search tool below to find specific information within the annual report.-
 1
1 -
2
-
3
-
4
-
5
-
6
-
7
-
8
-
9
-
10
-
11
-
12
-
13
-
14
-
15
-
16
-
17
-
18
-
19
-
20
-
21
-
22
-
23
-
24
-
25
-
26
-
27
-
28
-
29
-
30
-
31
-
32
-
33
-
34
-
35
-
36
-
37
-
38
-
39
-
40
-
41
-
42
-
43
-
44
-
45
-
46
-
47
-
48
-
49
-
50
-
51
-
52
-
53
-
54
-
55
-
56
-
57
-
58
-
59
-
60
-
61
-
62
-
63
-
64
-
65
-
66
-
67
-
68
-
69
-
70
-
71
-
72
-
73
-
74
-
75
-
76
-
77
-
78
-
79
-
80
-
81
-
82
-
83
-
84
-
85
-
86
-
87
-
88
-
89
-
90
-
91
-
92
-
93
-
94
-
95
-
96
-
97
-
98
-
99
-
100
-
101
-
102
-
103
-
104
-
105
-
106
-
107
-
108
-
109
-
 110
110 -
 111
111 -
 112
112 -
 113
113 -
 114
114 -
 115
115 -
 116
116 -
 117
117 -
 118
118 -
 119
119 -
 120
120 -
 121
121 -
 122
122 -
 123
123 -
 124
124 -
 125
125 -
 126
126 -
 127
127 -
 128
128 -
 129
129 -
 130
130 -
131
-
132
-
133
-
134
-
135
-
136
-
137
-
138
-
139
-
140
-
141
-
142
-
143
-
144
-
145
-
146
-
147
-
148
-
149
-
150
-
151
-
152
-
153
-
154
-
155
-
156
-
157
-
158
-
159
-
160
-
161
-
162
-
163
-
164
-
165
-
166
-
167
-
168
-
169
-
170
-
171
-
172
-
173
-
174
-
175
-
176
-
177
-
178
 |
 |

YUM! BRANDS, INC.-2013 Form10-K24
Form 10-K
PART II
ITEM7Management’s Discussion and Analysis of Financial Condition and Results of Operations
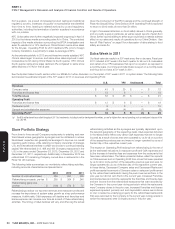
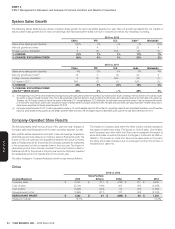
System Sales Growth
The following tables detail the key drivers of system sales growth for each reportable segment by year. Net unit growth represents the net impact of
actual system sales growth due to new unit openings and historical system sales lost due to closures as well as any necessary rounding.
2013 vs. 2012
China YRI U.S. India(a) Worldwide
Same store sales growth (decline) (13)% 1% —% —% (2)%
Net unit growth and other 9 4 1 20 4
Foreign currency translation 3 (4) N/A (9) (1)
% CHANGE (1)% 1% 1% 11% 1%
% CHANGE, EXCLUDING FOREX (4)% 5% 1% 20% 2%
2012 vs. 2011
China YRI U.S. India Worldwide
Same store sales growth (decline) 4% 3% 5% 5% 4%
Net unit growth and other(b) 16 3 (5) 24 2
Foreign currency translation 3 (3) N/A (16) (1)
53rd week in 2011 N/A (1) (1) N/A (1)
% CHANGE 23% 2% (1)% 13% 4%
% CHANGE, EXCLUDING FOREX
AND53RDWEEK IN 2011 20% 6% —% 29% 6%
(a) At the beginning of fiscal 2013, we eliminated the period lag that was previously used to facilitate the reporting of our India Division’s results. Accordingly, the India Division’s 2013 results include
the months of January through December 2013. Due to the immateriality of the India Division’s results we did not restate the prior year’s operating results for the elimination of this period lag.
Therefore, the 2012 results continue to include the months of December 2011 through November 2012. Additionally, the table above compares these months. If we had compared like months
in 2013 to 2012, India Division system sales, excluding the impact of foreign currency translation, would have been 2% higher and same-store sales would have been 1% lower versus what is
shown above, respectively for the year ended December 28, 2013.
(b) For the year ended December 29, 2012, system sales growth includes a 1% and 5% negative impact for YRI and the U.S., respectively, related to the LJS and A&W divestitures and a 3% positive
impact for China related to the acquisition of Little Sheep. Combined these items had a 2% net negative impact for Worldwide system sales for the year ended December 29, 2012.
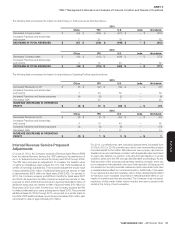
Company-Operated Store Results
The following tables detail the key drivers of the year-over-year changes of
Company sales and Restaurant profit for each reportable segment by year.
Store portfolio actions represent the net impact of new unit openings, acquisitions,
refranchisings and store closures on Company sales or Restaurant profit. The
impact of new unit openings and acquisitions represent the actual Company
sales or Restaurant profit for the periods the Company operated the restaurants
in the current year but did not operate them in the prior year. The impact of
refranchisings and store closures represent the actual Company sales or
Restaurant profit for the periods in the prior year while the Company operated
the restaurants but did not operate them in the current year.
The impact on Company sales within the Other column primarily represents
the impact of same-store sales. The impact on Cost of sales, Cost of labor
and Occupancy and other within the Other column represents the impact of
same-store sales, as well as the impact of changes in costs such as inflation/
deflation� The impact on costs from same-store sales varies to the extent
the same-store sales change is due to a change in pricing, the number of
transactions or sales mix�
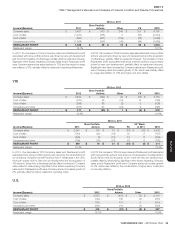
The dollar changes in Company Restaurant profit by year were as follows:
China
2013 vs. 2012
Income/(Expense) 2012
Store Portfolio
Actions Other FX 2013
Company sales $ 6,797 $ 611 $ (785) $ 177 $ 6,800
Cost of sales (2,312) (190) 303 (59) (2,258)
Cost of labor (1,259) (129) 62 (34) (1,360)
Occupancy and other (1,993) (211) 127 (55) (2,132)
RESTAURANT PROFIT $ 1,233 $ 81 $ (293) $ 29 $ 1,050
Restaurant margin 18.1% 15.4%