Pizza Hut 2013 Annual Report Download - page 77
Download and view the complete annual report
Please find page 77 of the 2013 Pizza Hut annual report below. You can navigate through the pages in the report by either clicking on the pages listed below, or by using the keyword search tool below to find specific information within the annual report.-
 1
1 -
2
-
3
-
4
-
5
-
6
-
7
-
8
-
9
-
10
-
11
-
12
-
13
-
14
-
15
-
16
-
17
-
18
-
19
-
20
-
21
-
22
-
23
-
24
-
25
-
26
-
27
-
28
-
29
-
30
-
31
-
32
-
33
-
34
-
35
-
36
-
37
-
38
-
39
-
40
-
41
-
42
-
43
-
44
-
45
-
46
-
47
-
48
-
49
-
50
-
51
-
52
-
53
-
54
-
55
-
56
-
57
-
58
-
59
-
60
-
61
-
62
-
63
-
64
-
65
-
66
-
 67
67 -
 68
68 -
 69
69 -
 70
70 -
 71
71 -
 72
72 -
 73
73 -
 74
74 -
 75
75 -
 76
76 -
 77
77 -
 78
78 -
 79
79 -
 80
80 -
 81
81 -
 82
82 -
 83
83 -
 84
84 -
 85
85 -
 86
86 -
 87
87 -
88
-
89
-
90
-
91
-
92
-
93
-
94
-
95
-
96
-
97
-
98
-
99
-
100
-
101
-
102
-
103
-
104
-
105
-
106
-
107
-
108
-
109
-
110
-
111
-
112
-
113
-
114
-
115
-
116
-
117
-
118
-
119
-
120
-
121
-
122
-
123
-
124
-
125
-
126
-
127
-
128
-
129
-
130
-
131
-
132
-
133
-
134
-
135
-
136
-
137
-
138
-
139
-
140
-
141
-
142
-
143
-
144
-
145
-
146
-
147
-
148
-
149
-
150
-
151
-
152
-
153
-
154
-
155
-
156
-
157
-
158
-
159
-
160
-
161
-
162
-
163
-
164
-
165
-
166
-
167
-
168
-
169
-
170
-
171
-
172
-
173
-
174
-
175
-
176
-
177
-
178
 |
 |

YUM! BRANDS, INC.-2014Proxy Statement 55
Proxy Statement
EXECUTIVE COMPENSATION
Name
Executive
Contributions
in Last FY
($)(1)
Registrant
Contributions
in Last FY
($)(2)
Aggregate
Earnings in
Last FY
($)(3)
Aggregate
Withdrawals/
Distributions
($)(4)
Aggregate
Balance at
Last FYE
($)(5)
(a) (b) (c) (d) (e) (f)
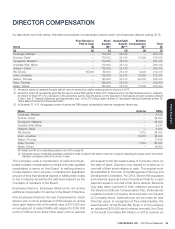
Novak 7,315,445 27,958,150 26,608,702 475,401 231,226,476
Grismer 760,760 377,087 337,781 5,513 2,478,162
Su 3,183,968 — 891,966 3,206,011 8,516,801
Creed 1,282,223 225,000 978,829 419,171 8,141,880
Pant — 300,000 1,031,605 11,672 9,202,644
(1) Amounts in column (b) reflect amounts that were also reported as compensation in our Summary Compensation Table filed last year or, would have been
reported as compensation in our Summary Compensation Table last year if the executive were a NEO.
(2) Amounts in column (c) reflect Company contributions for EID Program matching contribution, LRP and/or TCN allocation as follows: Mr. Grismer, $253,587
EID matching contribution and $123,500 LRP allocation; Mr. Creed, $225,000 TCN allocation; and Mr. Pant, $300,000 LRP allocation. For Mr. Novak, the
amount in this column represents the beginning balance in his LRP account as a result of the transfer of his benefit out of the PEP effective January 1, 2013
($27,600,000) and his LRP allocation ($358,150). See footnote 5 of the Summary Compensation Table for more detail.
(3) Amounts in column (d) reflect earnings during the last fiscal year on deferred amounts. All earnings are based on the investment alternatives offered under
the EID Program or the earnings credit provided under the LRP or the TCN described in the narrative above this table. The EID Program earnings are market
based returns and, therefore, are not reported in the Summary Compensation Table. For Messrs. Grismer and Pant, of their earnings reflected in this column,
$3,977 and $15,640 respectively were deemed above market earnings accruing to each of their accounts under the LRP. For Mr. Creed, of his earnings
reflected in this column, $7,348 were deemed above market earnings accruing to his account under the TCN. Mr. Novak receives a market rate of interest on
his account under the LRP. For above market earnings on nonqualified deferred compensation, see the “Change in Pension Value and Nonqualified Deferred
Compensation Earnings” column of the Summary Compensation Table.
(4) All amounts shown in column (e) were distributed in accordance with the executive’s deferral election, except in the case of the following amounts distributed
to pay payroll taxes due upon their account balance under the EID Program, LRP or TCN for 2013. For Messrs. Novak and Creed, their distributions reflected
in this column also include immaterial tax adjustments for the payout of 2009 and 2010 PSU awards ($55,883 and $11,135 respectively).
Novak 249,030
Grismer 5,513
Creed 10,708
Pant 11,672
(5) Amounts reflected in column (f) are the year-end balances for each executive under the EID Program, TCN and the LRP. As required under SEC rules, below
is the portion of the year-end balance for each executive which has previously been reported as compensation to the executive in the Company’s Summary
Compensation Table for 2013 and prior years or would have been reported as compensation if the executive had been a Named Executive Officer in those
previous years.
Novak 86,280,385
Grismer 2,096,682
Su 7,536,875
Creed 3,916,822
Pant 4,640,205
The difference between these amounts and the amount of the year-end balance for each executive represents the total
aggregate earnings accumulated under the program with respect to that compensation.