Pizza Hut 2013 Annual Report Download - page 119
Download and view the complete annual report
Please find page 119 of the 2013 Pizza Hut annual report below. You can navigate through the pages in the report by either clicking on the pages listed below, or by using the keyword search tool below to find specific information within the annual report.-
 1
1 -
2
-
3
-
4
-
5
-
6
-
7
-
8
-
9
-
10
-
11
-
12
-
13
-
14
-
15
-
16
-
17
-
18
-
19
-
20
-
21
-
22
-
23
-
24
-
25
-
26
-
27
-
28
-
29
-
30
-
31
-
32
-
33
-
34
-
35
-
36
-
37
-
38
-
39
-
40
-
41
-
42
-
43
-
44
-
45
-
46
-
47
-
48
-
49
-
50
-
51
-
52
-
53
-
54
-
55
-
56
-
57
-
58
-
59
-
60
-
61
-
62
-
63
-
64
-
65
-
66
-
67
-
68
-
69
-
70
-
71
-
72
-
73
-
74
-
75
-
76
-
77
-
78
-
79
-
80
-
81
-
82
-
83
-
84
-
85
-
86
-
87
-
88
-
89
-
90
-
91
-
92
-
93
-
94
-
95
-
96
-
97
-
98
-
99
-
100
-
101
-
102
-
103
-
104
-
105
-
106
-
107
-
108
-
 109
109 -
 110
110 -
 111
111 -
 112
112 -
 113
113 -
 114
114 -
 115
115 -
 116
116 -
 117
117 -
 118
118 -
 119
119 -
 120
120 -
 121
121 -
 122
122 -
 123
123 -
 124
124 -
 125
125 -
 126
126 -
 127
127 -
 128
128 -
 129
129 -
130
-
131
-
132
-
133
-
134
-
135
-
136
-
137
-
138
-
139
-
140
-
141
-
142
-
143
-
144
-
145
-
146
-
147
-
148
-
149
-
150
-
151
-
152
-
153
-
154
-
155
-
156
-
157
-
158
-
159
-
160
-
161
-
162
-
163
-
164
-
165
-
166
-
167
-
168
-
169
-
170
-
171
-
172
-
173
-
174
-
175
-
176
-
177
-
178
 |
 |

YUM! BRANDS, INC.-2013 Form10-K 23
Form 10-K
PART II
ITEM7Management’s Discussion and Analysis of Financial Condition and Results of Operations
U.S. Franchisees Company
Unconsolidated
Affiliates
Total Excluding
Licensees(a)
Balance at end of 2011 13,867 2,139 — 16,006
New Builds 273 96 — 369
Refranchising 468 (468) — —
Closures (312) (34) — (346)
Other (2) — — (2)
Balance at end of 2012 14,294 1,733 — 16,027
New Builds 323 89 — 412
Acquisitions (19) 19 — —
Refranchising 214 (214) — —
Closures (296) (39) — (335)
Other 6 — — 6
BALANCE AT END OF 2013 14,522 1,588 — 16,110
% of Total 90% 10% —% 100%
India Franchisees Company
Unconsolidated
Affiliates
Total Excluding
Licensees(a)
Balance at end of 2011 384 82 — 466
New Builds 103 35 — 138
Acquisitions (3) 3 — —
Closures (11) — — (11)
Balance at end of 2012 473 120 — 593
New Builds 89 68 — 157
Acquisitions (6) 6 — —
Closures (14) (3) — (17)
BALANCE AT END OF 2013 542 191 — 733
% of Total 74% 26% —% 100%
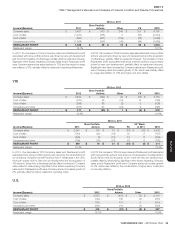
(a) The Worldwide, YRI and U.S. totals exclude 2,115, 119 and 1,996 licensed units, respectively, at December 28, 2013. While there are no licensed units in China, we have excluded from
the Worldwide and China totals 7 Company-owned units that are similar to licensed units. There are no licensed units in India. The units excluded offer limited menus and operate in non-
traditional locations like malls, airports, gasoline service stations, train stations, subways, convenience stores, stadiums and amusement parks where a full scale traditional outlet would not
be practical or efficient. As licensed units have lower average unit sales volumes than our traditional units and our current strategy does not place a significant emphasis on expanding our
licensed units, we do not believe that providing further detail of licensed unit activity provides significant or meaningful information at this time.
(b) Includes 472 Little Sheep units acquired on February 1, 2012.
Multibrand restaurants are included in the totals above. Multibrand conversions increase the sales and points of distribution for the second brand added
to a restaurant but do not result in an additional unit count. Similarly, a new multibrand restaurant, while increasing sales and points of distribution for
two brands, results in just one additional unit count.