Pizza Hut 2013 Annual Report Download - page 136
Download and view the complete annual report
Please find page 136 of the 2013 Pizza Hut annual report below. You can navigate through the pages in the report by either clicking on the pages listed below, or by using the keyword search tool below to find specific information within the annual report.-
 1
1 -
2
-
3
-
4
-
5
-
6
-
7
-
8
-
9
-
10
-
11
-
12
-
13
-
14
-
15
-
16
-
17
-
18
-
19
-
20
-
21
-
22
-
23
-
24
-
25
-
26
-
27
-
28
-
29
-
30
-
31
-
32
-
33
-
34
-
35
-
36
-
37
-
38
-
39
-
40
-
41
-
42
-
43
-
44
-
45
-
46
-
47
-
48
-
49
-
50
-
51
-
52
-
53
-
54
-
55
-
56
-
57
-
58
-
59
-
60
-
61
-
62
-
63
-
64
-
65
-
66
-
67
-
68
-
69
-
70
-
71
-
72
-
73
-
74
-
75
-
76
-
77
-
78
-
79
-
80
-
81
-
82
-
83
-
84
-
85
-
86
-
87
-
88
-
89
-
90
-
91
-
92
-
93
-
94
-
95
-
96
-
97
-
98
-
99
-
100
-
101
-
102
-
103
-
104
-
105
-
106
-
107
-
108
-
109
-
110
-
111
-
112
-
113
-
114
-
115
-
116
-
117
-
118
-
119
-
120
-
121
-
122
-
123
-
124
-
125
-
 126
126 -
 127
127 -
 128
128 -
 129
129 -
 130
130 -
 131
131 -
 132
132 -
 133
133 -
 134
134 -
 135
135 -
 136
136 -
 137
137 -
 138
138 -
 139
139 -
 140
140 -
 141
141 -
 142
142 -
 143
143 -
 144
144 -
 145
145 -
 146
146 -
147
-
148
-
149
-
150
-
151
-
152
-
153
-
154
-
155
-
156
-
157
-
158
-
159
-
160
-
161
-
162
-
163
-
164
-
165
-
166
-
167
-
168
-
169
-
170
-
171
-
172
-
173
-
174
-
175
-
176
-
177
-
178
 |
 |

YUM! BRANDS, INC.-2013 Form10-K40
Form 10-K
PART II
ITEM 8Financial Statements andSupplementaryData
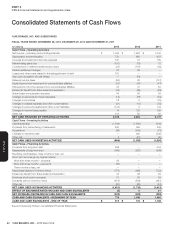
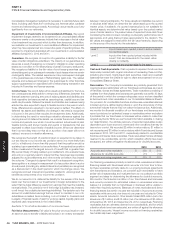
Consolidated Statements of Cash Flows
YUM! BRANDS, INC. AND SUBSIDIARIES
FISCAL YEARS ENDED DECEMBER 28, 2013, DECEMBER 29, 2012 AND DECEMBER 31, 2011
(in millions)
2013 2012 2011
Cash Flows – Operating Activities
Net Income – including noncontrolling interests $ 1,064 $ 1,608 $ 1,335
Depreciation and amortization 721 665 637
Closures and impairment (income) expenses 331 37 135
Refranchising (gain) loss (100) (78) 72
Contributions to defined benefit pension plans (23) (119) (63)
Pension settlement charges 30 89 —
Losses and other costs related to the extinguishment of debt 120 — —
Gain upon acquisition of Little Sheep — (74) —
Deferred income taxes (24) 28 (137)
Equity income from investments in unconsolidated affiliates (26) (47) (47)
Distributions of income received from unconsolidated affiliates 43 41 39
Excess tax benefit from share-based compensation (44) (98) (66)
Share-based compensation expense 49 50 59
Changes in accounts and notes receivable (12) (18) (39)
Changes in inventories 18 9 (75)
Changes in prepaid expenses and other current assets (21) (14) (25)
Changes in accounts payable and other current liabilities (102) 9 144
Changes in income taxes payable 14 126 109
Other, net 101 80 92
NET CASH PROVIDED BY OPERATING ACTIVITIES 2,139 2,294 2,170
Cash Flows – Investing Activities
Capital spending (1,049) (1,099) (940)
Proceeds from refranchising of restaurants 260 364 246
Acquisitions (99) (543) (81)
Changes in restricted cash — 300 (300)
Other, net 2 (27) 69
NET CASH USED IN INVESTING ACTIVITIES (886) (1,005) (1,006)
Cash Flows – Financing Activities
Proceeds from long-term debt 599 — 404
Repayments of long-term debt (666) (282) (666)
Revolving credit facilities, three months or less, net — — —
Short-term borrowings, by original maturity
More than three months – proceeds 56 — —
More than three months – payments (56) — —
Three months or less, net — — —
Repurchase shares of Common Stock (770) (965) (752)
Excess tax benefit from share-based compensation 44 98 66
Employee stock option proceeds 37 62 59
Dividends paid on Common Stock (615) (544) (481)
Other, net (80) (85) (43)
NET CASH USED IN FINANCING ACTIVITIES (1,451) (1,716) (1,413)
EFFECT OF EXCHANGE RATES ON CASH AND CASH EQUIVALENTS (5) 5 21
NET INCREASE (DECREASE) IN CASH AND CASH EQUIVALENTS (203) (422) (228)
CASH AND CASH EQUIVALENTS – BEGINNING OF YEAR 776 1,198 1,426
CASH AND CASH EQUIVALENTS – END OF YEAR $ 573 $ 776 $ 1,198
See accompanying Notes to Consolidated Financial Statements.