Nokia 2004 Annual Report Download - page 9
Download and view the complete annual report
Please find page 9 of the 2004 Nokia annual report below. You can navigate through the pages in the report by either clicking on the pages listed below, or by using the keyword search tool below to find specific information within the annual report.-
 1
1 -
 2
2 -
 3
3 -
 4
4 -
 5
5 -
 6
6 -
 7
7 -
 8
8 -
 9
9 -
 10
10 -
 11
11 -
 12
12 -
 13
13 -
 14
14 -
 15
15 -
 16
16 -
 17
17 -
 18
18 -
 19
19 -
 20
20 -
21
-
22
-
23
-
24
-
25
-
26
-
27
-
28
-
29
-
30
-
31
-
32
-
33
-
34
-
35
-
36
-
37
-
38
-
39
-
40
-
41
-
42
-
43
-
44
-
45
-
46
-
47
-
48
-
49
-
50
-
51
-
52
-
53
-
54
-
55
-
56
-
57
-
58
-
59
-
60
-
61
-
62
-
63
-
64
-
65
-
66
-
67
-
68
-
69
-
70
-
71
-
72
-
73
-
74
-
75
-
76
-
77
-
78
-
79
-
80
-
81
-
82
-
83
-
84
-
85
-
86
-
87
-
88
-
89
-
90
-
91
-
92
-
93
-
94
-
95
-
96
-
97
-
98
-
99
-
100
-
101
-
102
-
103
-
104
-
105
-
106
-
107
-
108
-
109
-
110
-
111
-
112
-
113
-
114
-
115
-
116
-
117
-
118
-
119
-
120
-
121
-
122
-
123
-
124
-
125
-
126
-
127
-
128
-
129
-
130
-
131
-
132
-
133
-
134
-
135
-
136
-
137
-
138
-
139
-
140
-
141
-
142
-
143
-
144
-
145
-
146
-
147
-
148
-
149
-
150
-
151
-
152
-
153
-
154
-
155
-
156
-
157
-
158
-
159
-
160
-
161
-
162
-
163
-
164
-
165
-
166
-
167
-
168
-
169
-
170
-
171
-
172
-
173
-
174
-
175
-
176
-
177
-
178
-
179
-
180
-
181
-
182
-
183
-
184
-
185
-
186
-
187
-
188
-
189
-
190
-
191
-
192
-
193
-
194
-
195
 |
 |

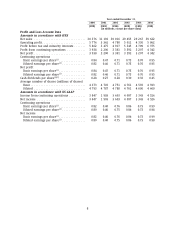
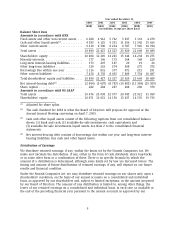
Year ended December 31,
2000 2001 2002 2003 2004 2004
(EUR) (EUR) (EUR) (EUR) (EUR) (USD)
(in millions, except per share data)
Profit and Loss Account Data
Amounts in accordance with IFRS
Net sales ............................... 30 376 31 191 30 016 29 455 29 267 39 622
Operating profit .......................... 5 776 3 362 4 780 5 011 4 330 5 862
Profit before tax and minority interests ....... 5 862 3 475 4 917 5 345 4 709 6 375
Profit from continuing operations ........... 3 938 2 200 3 381 3 592 3 207 4 342
Net profit ............................... 3 938 2 200 3 381 3 592 3 207 4 342
Continuing operations
Basic earnings per share(1) ................ 0.84 0.47 0.71 0.75 0.70 0.95
Diluted earnings per share(1) .............. 0.82 0.46 0.71 0.75 0.70 0.95
Net profit
Basic earnings per share(1) ................ 0.84 0.47 0.71 0.75 0.70 0.95
Diluted earnings per share(1) .............. 0.82 0.46 0.71 0.75 0.70 0.95
Cash dividends per share(1)(2) ............... 0.28 0.27 0.28 0.30 0.33 0.45
Average number of shares (millions of shares)
Basic ................................. 4 673 4 703 4 751 4 761 4 593 4 593
Diluted ............................... 4 793 4 787 4 788 4 761 4 600 4 600
Amounts in accordance with US GAAP
Income from continuing operations .......... 3 847 1 903 3 603 4 097 3 343 4 526
Net income ............................. 3 847 1 903 3 603 4 097 3 343 4 526
Continuing operations
Basic earnings per share(1) ................ 0.82 0.40 0.76 0.86 0.73 0.99
Diluted earnings per share(1) .............. 0.80 0.40 0.75 0.86 0.73 0.98
Net income
Basic earnings per share(1) ................ 0.82 0.40 0.76 0.86 0.73 0.99
Diluted earnings per share(1) .............. 0.80 0.40 0.75 0.86 0.73 0.98
8