Nokia 2004 Annual Report Download - page 13
Download and view the complete annual report
Please find page 13 of the 2004 Nokia annual report below. You can navigate through the pages in the report by either clicking on the pages listed below, or by using the keyword search tool below to find specific information within the annual report.-
 1
1 -
2
-
 3
3 -
 4
4 -
 5
5 -
 6
6 -
 7
7 -
 8
8 -
 9
9 -
 10
10 -
 11
11 -
 12
12 -
 13
13 -
 14
14 -
 15
15 -
 16
16 -
 17
17 -
 18
18 -
 19
19 -
 20
20 -
 21
21 -
 22
22 -
 23
23 -
24
-
25
-
26
-
27
-
28
-
29
-
30
-
31
-
32
-
33
-
34
-
35
-
36
-
37
-
38
-
39
-
40
-
41
-
42
-
43
-
44
-
45
-
46
-
47
-
48
-
49
-
50
-
51
-
52
-
53
-
54
-
55
-
56
-
57
-
58
-
59
-
60
-
61
-
62
-
63
-
64
-
65
-
66
-
67
-
68
-
69
-
70
-
71
-
72
-
73
-
74
-
75
-
76
-
77
-
78
-
79
-
80
-
81
-
82
-
83
-
84
-
85
-
86
-
87
-
88
-
89
-
90
-
91
-
92
-
93
-
94
-
95
-
96
-
97
-
98
-
99
-
100
-
101
-
102
-
103
-
104
-
105
-
106
-
107
-
108
-
109
-
110
-
111
-
112
-
113
-
114
-
115
-
116
-
117
-
118
-
119
-
120
-
121
-
122
-
123
-
124
-
125
-
126
-
127
-
128
-
129
-
130
-
131
-
132
-
133
-
134
-
135
-
136
-
137
-
138
-
139
-
140
-
141
-
142
-
143
-
144
-
145
-
146
-
147
-
148
-
149
-
150
-
151
-
152
-
153
-
154
-
155
-
156
-
157
-
158
-
159
-
160
-
161
-
162
-
163
-
164
-
165
-
166
-
167
-
168
-
169
-
170
-
171
-
172
-
173
-
174
-
175
-
176
-
177
-
178
-
179
-
180
-
181
-
182
-
183
-
184
-
185
-
186
-
187
-
188
-
189
-
190
-
191
-
192
-
193
-
194
-
195
 |
 |

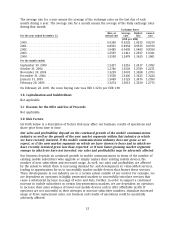
The average rate for a year means the average of the exchange rates on the last day of each
month during a year. The average rate for a month means the average of the daily exchange rates
during that month.
Exchange Rates
Rate at Average Highest Lowest
For the year ended December 31: period end rate rate rate
(USD per EUR)
2000 ............................................. 0.9388 0.9232 1.0335 0.8270
2001 ............................................. 0.8901 0.8954 0.9535 0.8370
2002 ............................................. 1.0485 0.9495 1.0485 0.8594
2003 ............................................. 1.2597 1.1411 1.2597 1.0361
2004 ............................................. 1.3538 1.2478 1.3625 1.1801
For the month ended:
September 30, 2004 ................................. 1.2417 1.2216 1.2417 1.2052
October 31, 2004 ................................... 1.2746 1.2503 1.2789 1.2271
November 30, 2004 ................................. 1.3259 1.3001 1.3288 1.2703
December 31, 2004 ................................. 1.3538 1.3406 1.3625 1.3224
January 31, 2005 ................................... 1.3049 1.3123 1.3476 1.2954
February 28, 2005 .................................. 1.3274 1.3013 1.3230 1.2773
On February 28, 2005, the noon buying rate was USD 1.3274 per EUR 1.00.
3.B Capitalization and Indebtedness
Not applicable.
3.C Reasons for the Offer and Use of Proceeds
Not applicable.
3.D Risk Factors
Set forth below is a description of factors that may affect our business, results of operations and
share price from time to time.
Our sales and profitability depend on the continued growth of the mobile communications
industry as well as the growth of the new market segments within that industry in which
we have recently invested. If the mobile communications industry does not grow as we
expect, or if the new market segments on which we have chosen to focus and in which we
have recently invested grow less than expected, or if new faster-growing market segments
emerge in which we have not invested, our sales and profitability may be adversely affected.
Our business depends on continued growth in mobile communications in terms of the number of
existing mobile subscribers who upgrade or simply replace their existing mobile devices, the
number of new subscribers and increased usage. As well, our sales and profitability are affected
by the extent to which there is increasing demand for, and development of, value-added services,
leading to opportunities for us to successfully market mobile devices that feature these services.
These developments in our industry are to a certain extent outside of our control. For example, we
are dependent on operators in highly penetrated markets to successfully introduce services that
cause a substantial increase in usage of voice and data. Further, in order to support a continued
increase in mobile subscribers in certain low-penetration markets, we are dependent on operators
to increase their sales volumes of lower-cost mobile devices and to offer affordable tariffs. If
operators are not successful in their attempts to increase subscriber numbers, stimulate increased
usage or drive replacement sales, our business and results of operations could be materially
adversely affected.
12