Nokia 2004 Annual Report Download - page 55
Download and view the complete annual report
Please find page 55 of the 2004 Nokia annual report below. You can navigate through the pages in the report by either clicking on the pages listed below, or by using the keyword search tool below to find specific information within the annual report.-
 1
1 -
2
-
3
-
4
-
5
-
6
-
7
-
8
-
9
-
10
-
11
-
12
-
13
-
14
-
15
-
16
-
17
-
18
-
19
-
20
-
21
-
22
-
23
-
24
-
25
-
26
-
27
-
28
-
29
-
30
-
31
-
32
-
33
-
34
-
35
-
36
-
37
-
38
-
39
-
40
-
41
-
42
-
43
-
44
-
 45
45 -
 46
46 -
 47
47 -
 48
48 -
 49
49 -
 50
50 -
 51
51 -
 52
52 -
 53
53 -
 54
54 -
 55
55 -
 56
56 -
 57
57 -
 58
58 -
 59
59 -
 60
60 -
 61
61 -
 62
62 -
 63
63 -
 64
64 -
 65
65 -
66
-
67
-
68
-
69
-
70
-
71
-
72
-
73
-
74
-
75
-
76
-
77
-
78
-
79
-
80
-
81
-
82
-
83
-
84
-
85
-
86
-
87
-
88
-
89
-
90
-
91
-
92
-
93
-
94
-
95
-
96
-
97
-
98
-
99
-
100
-
101
-
102
-
103
-
104
-
105
-
106
-
107
-
108
-
109
-
110
-
111
-
112
-
113
-
114
-
115
-
116
-
117
-
118
-
119
-
120
-
121
-
122
-
123
-
124
-
125
-
126
-
127
-
128
-
129
-
130
-
131
-
132
-
133
-
134
-
135
-
136
-
137
-
138
-
139
-
140
-
141
-
142
-
143
-
144
-
145
-
146
-
147
-
148
-
149
-
150
-
151
-
152
-
153
-
154
-
155
-
156
-
157
-
158
-
159
-
160
-
161
-
162
-
163
-
164
-
165
-
166
-
167
-
168
-
169
-
170
-
171
-
172
-
173
-
174
-
175
-
176
-
177
-
178
-
179
-
180
-
181
-
182
-
183
-
184
-
185
-
186
-
187
-
188
-
189
-
190
-
191
-
192
-
193
-
194
-
195
 |
 |

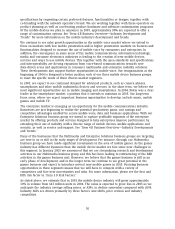
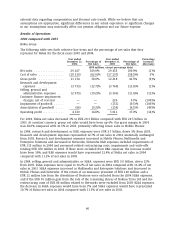
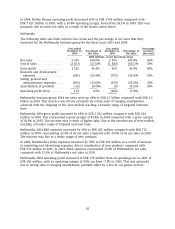
Networks Net Sales by Geographic Area
Year ended Year ended Year ended
December 31, Change (%) December 31, Change (%) December 31,
2004 2003 to 2004 2003 2002 to 2003 2002
(EUR millions, except percentage data)
Europe, Middle-East & Africa . . 3 116 12% 2 790 (18)% 3 423
China .................... 852 29% 663 (0)% 666
Asia-Pacific ............... 906 22% 744 (30)% 1 070
North America ............. 984 (7)% 1 055 (1)% 1 064
Latin America ............. 509 38% 368 16% 316
Total .................... 6 367 13% 5 620 (14)% 6 539
Networks sales are also driven by price developments. Like our mobile devices business, the
products and solutions offered by our Networks business are subject to gradual price erosion over
time, largely as a result of competitive pressures in the markets where we operate. We endeavor
to mitigate the strong pricing pressures that result from increased competition by improving
operational efficiency and developing higher margin differentiated solutions for our customers.
Additionally, Networks sales depend upon the prevalence of the specific technologies on which we
have chosen to focus. Networks currently focuses on the GSM family of radio technologies,
including GSM, EDGE and WCDMA 3G networks, and core networks with increasing IP and multi-
access capabilities. The pace of WCDMA 3G rollouts picked up during 2004, and by the end of the
year 63 operators had launched commercial WCDMA 3G services. Nokia supplied 3G technology to
28 of these operators. Demand for our products and solutions depends on the extent to which
these technologies continue to enjoy popularity with operators and end-users, and on the extent to
which we are able to identify correctly and respond to changes in operators’ and end-users’
technology preferences as different technology platforms emerge over time.
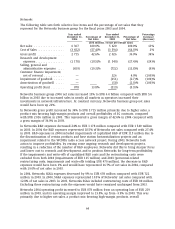
Networks profitability is affected by the level of our R&D spending. In prior years, the level of R&D
in our infrastructure business has been high due to the simultaneous development of multiple
radio access technologies and new core network platforms. In 2004, our research and
developments costs were 18.5% of our net sales. We are targeting our infrastructure R&D spend to
be approximately 14% of net sales by the end of 2006. We aim to achieve this objective by
increasing R&D efficiency and also by more focused R&D spend.
Going forward, we believe that we have the potential to grow our net sales and improve our
profitability further on the infrastructure side by addressing enterprises’ demand for interoperable
corporate infrastructure products such as firewalls, SSL and IP VPNs, and antivirus software for
both devices and the network center. The infrastructure business of Enterprise Solutions aims to
capitalize on this demand.
For further information regarding our business and operations please see ‘‘Item 4 Information on
the Company.’’
Certain Other Factors
United States Dollar
In 2004, the US dollar continued to depreciate against the euro, falling by 7.1% in 2004 (year-end
rate compared to year-end rate for the previous year). This currency development had a material
negative impact on our net sales expressed in euros because somewhat more than 50% of our net
sales are generated in US dollars and currencies closely following the US dollar. However,
depreciation of the US dollar also contributed to a lower average product cost as more than 50%
54