Nokia 2004 Annual Report Download - page 65
Download and view the complete annual report
Please find page 65 of the 2004 Nokia annual report below. You can navigate through the pages in the report by either clicking on the pages listed below, or by using the keyword search tool below to find specific information within the annual report.-
 1
1 -
2
-
3
-
4
-
5
-
6
-
7
-
8
-
9
-
10
-
11
-
12
-
13
-
14
-
15
-
16
-
17
-
18
-
19
-
20
-
21
-
22
-
23
-
24
-
25
-
26
-
27
-
28
-
29
-
30
-
31
-
32
-
33
-
34
-
35
-
36
-
37
-
38
-
39
-
40
-
41
-
42
-
43
-
44
-
45
-
46
-
47
-
48
-
49
-
50
-
51
-
52
-
53
-
54
-
 55
55 -
 56
56 -
 57
57 -
 58
58 -
 59
59 -
 60
60 -
 61
61 -
 62
62 -
 63
63 -
 64
64 -
 65
65 -
 66
66 -
 67
67 -
 68
68 -
 69
69 -
 70
70 -
 71
71 -
 72
72 -
 73
73 -
 74
74 -
 75
75 -
76
-
77
-
78
-
79
-
80
-
81
-
82
-
83
-
84
-
85
-
86
-
87
-
88
-
89
-
90
-
91
-
92
-
93
-
94
-
95
-
96
-
97
-
98
-
99
-
100
-
101
-
102
-
103
-
104
-
105
-
106
-
107
-
108
-
109
-
110
-
111
-
112
-
113
-
114
-
115
-
116
-
117
-
118
-
119
-
120
-
121
-
122
-
123
-
124
-
125
-
126
-
127
-
128
-
129
-
130
-
131
-
132
-
133
-
134
-
135
-
136
-
137
-
138
-
139
-
140
-
141
-
142
-
143
-
144
-
145
-
146
-
147
-
148
-
149
-
150
-
151
-
152
-
153
-
154
-
155
-
156
-
157
-
158
-
159
-
160
-
161
-
162
-
163
-
164
-
165
-
166
-
167
-
168
-
169
-
170
-
171
-
172
-
173
-
174
-
175
-
176
-
177
-
178
-
179
-
180
-
181
-
182
-
183
-
184
-
185
-
186
-
187
-
188
-
189
-
190
-
191
-
192
-
193
-
194
-
195
 |
 |

Networks
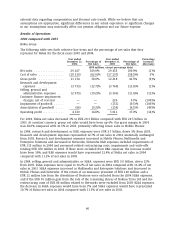
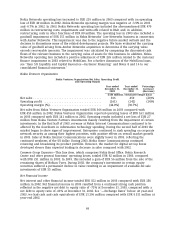
The following table sets forth selective line items and the percentage of net sales that they
represent for the Networks business group for the fiscal years 2003 and 2004.
Year ended Year ended Percentage
December 31, Percentage of December 31, Percentage of Increase/
2004 Net Sales 2003 Net Sales (decrease)
(EUR millions, except percentage data)
Net sales .................. 6 367 100.0% 5 620 100.0% 13%
Cost of Sales ................ (3 652) (57.4)% (3 594) (64.0)% 2%
Gross profit ................ 2 715 42.6% 2 026 36.0% 34%
Research and development
expenses ................. (1 178) (18.5)% (1 540) (27.4)% (24)%
Selling, general and
administrative expenses .... (659) (10.3)% (722) (12.8)% (9)%
Customer finance impairment,
net of reversal ............ — 226 4.0% (100)%
Impairment of goodwill ...... — (151) (2.7)% (100)%
Amortization of goodwill ..... — (58) (1.0)% (100)%
Operating profit (loss) ........ 878 13.8% (219) (3.9)%
Networks business group 2004 net sales increased 13% to EUR 6.4 billion compared with EUR 5.6
billion in 2003 due to increased sales in nearly all markets as operators increased their
investments in network infrastructure. At constant currency, Networks business group net sales
would have been up 21%.
In Networks gross profit increased by 34% to EUR 2 715 million primarily due to higher sales, a
product mix favoring high-margin products and overall profitability of 3G contracts, compared
with EUR 2 026 million in 2003. This represented a gross margin of 42.6% in 2004 compared with
a gross margin of 36.0% in 2003.
In Networks R&D expenses decreased 24% to EUR 1 178 million compared with EUR 1 540 million
in 2003. In 2004 the R&D expenses represented 18.5% of Networks net sales compared with 27.4%
in 2003. R&D expenses in 2004 included impairments of capitalized R&D of EUR 115 million due to
the discontinuation of certain products and base station horizontalization projects and an
impairment related to the WCDMA radio access network project. During 2003, Networks took
action to improve profitability, by ceasing some ongoing research and development projects,
resulting in a reduction of the number of R&D employees. Networks did this to bring sharper focus
and lower cost to research and development, and to position Networks for long-term profitability.
If the impairments and write-offs of capitalized R&D costs and the restructuring costs were
excluded from both 2004 (impairments of EUR 115 million) and 2003 (personnel-related
restructuring costs, impairments and write-offs totaling EUR 470 million), the decrease in R&D
expenses would have been 1% and would have represented 16.7% of net sales in 2004, compared
with 19.0% of net sales in 2003.
In 2004, Networks SG&A expenses decreased by 9% to EUR 659 million compared with EUR 722
million in 2003. In 2004, SG&A expenses represented 10.3% of Networks’ net sales compared with
12.8% of net sales in 2003. In 2003, Networks SG&A included restructuring costs of EUR 80 million.
Excluding these restructuring costs the expenses would have remained unchanged from 2003.
Networks 2004 operating profit increased to EUR 878 million from an operating loss of EUR 219
million in 2003, and its operating margin improved to 13.8%, up from -3.9% in 2003. This was
primarily due to higher net sales, a product mix favoring high-margin products, overall
64