Nokia 2004 Annual Report Download - page 54
Download and view the complete annual report
Please find page 54 of the 2004 Nokia annual report below. You can navigate through the pages in the report by either clicking on the pages listed below, or by using the keyword search tool below to find specific information within the annual report.-
 1
1 -
2
-
3
-
4
-
5
-
6
-
7
-
8
-
9
-
10
-
11
-
12
-
13
-
14
-
15
-
16
-
17
-
18
-
19
-
20
-
21
-
22
-
23
-
24
-
25
-
26
-
27
-
28
-
29
-
30
-
31
-
32
-
33
-
34
-
35
-
36
-
37
-
38
-
39
-
40
-
41
-
42
-
43
-
 44
44 -
 45
45 -
 46
46 -
 47
47 -
 48
48 -
 49
49 -
 50
50 -
 51
51 -
 52
52 -
 53
53 -
 54
54 -
 55
55 -
 56
56 -
 57
57 -
 58
58 -
 59
59 -
 60
60 -
 61
61 -
 62
62 -
 63
63 -
 64
64 -
65
-
66
-
67
-
68
-
69
-
70
-
71
-
72
-
73
-
74
-
75
-
76
-
77
-
78
-
79
-
80
-
81
-
82
-
83
-
84
-
85
-
86
-
87
-
88
-
89
-
90
-
91
-
92
-
93
-
94
-
95
-
96
-
97
-
98
-
99
-
100
-
101
-
102
-
103
-
104
-
105
-
106
-
107
-
108
-
109
-
110
-
111
-
112
-
113
-
114
-
115
-
116
-
117
-
118
-
119
-
120
-
121
-
122
-
123
-
124
-
125
-
126
-
127
-
128
-
129
-
130
-
131
-
132
-
133
-
134
-
135
-
136
-
137
-
138
-
139
-
140
-
141
-
142
-
143
-
144
-
145
-
146
-
147
-
148
-
149
-
150
-
151
-
152
-
153
-
154
-
155
-
156
-
157
-
158
-
159
-
160
-
161
-
162
-
163
-
164
-
165
-
166
-
167
-
168
-
169
-
170
-
171
-
172
-
173
-
174
-
175
-
176
-
177
-
178
-
179
-
180
-
181
-
182
-
183
-
184
-
185
-
186
-
187
-
188
-
189
-
190
-
191
-
192
-
193
-
194
-
195
 |
 |

reduced and/or delayed infrastructure investments by operators as they focused during those
years on decreasing debt and improving their capital structure primarily due to the combined
effects of the general economic slowdown and high 3G license costs. In order to improve
profitability, Nokia responded to these market developments by restructuring its infrastructure
business and reducing Networks headcount by almost 2000 people in 2003. Towards the end of
2003, the market started to stabilize somewhat. This stabilization continued into 2004, when
following three years of decline, we estimate that the mobile infrastructure market showed
year-on-year growth of approximately 14% in euro terms. This growth was largely the result of
operator investments in the current technologies of GSM, EDGE, and GPRS and their related
services, especially in low penetration markets, and in new-generation technologies, such as
WCDMA 3G.
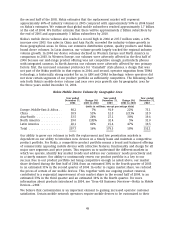
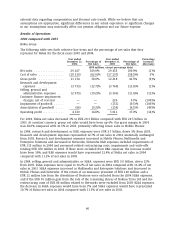
The following chart sets forth the global mobile infrastructure market size by geographic area,
based on Nokia’s estimates, for the three years ended December 31, 2004. Nokia’s estimate of the
value of mobile infrastructure market includes sales of mobile infrastructure equipment and
related services for all cellular standards.
Global Mobile Infrastructure Market Size by Geographic Area
based on Nokia’s Estimates
Year ended Year ended Year ended
December 31, Change (%) December 31, Change (%) December 31,
2004 2003 to 2004 2003 2002 to 2003 2002
(EUR billions, except percentage data)
Europe, Middle-East & Africa . . 17.2 17% 14.7 (15)% 17.2
China .................... 6.2 22% 5.1 (7)% 5.5
Asia-Pacific ............... 7.9 5% 7.5 (20)% 9.4
North America ............. 9.9 9% 9.1 (25)% 12.2
Latin America ............. 3.5 30% 2.7 (10)% 3.0
Total .................... 44.7 14% 39.1 (17)% 47.3
In mobile infrastructure, Nokia expects the overall market in 2005 to be slightly up compared with
2004 in euro terms. We expect operators to continue building coverage and expanding capacity in
low penetration markets as well as optimizing and expanding existing 2G networks in the more
developed markets but to a lesser extent than in 2004. The continued rollout of high-speed,
high-capacity 3G networks is expected to contribute to the market growth.
Networks sales and profitability are also affected by the product mix. Until the second half of
2002, all Nokia Networks infrastructure sales were related to 2G. In the second half of 2002, Nokia
started to recognize revenue from its first 3G contracts. In 2003, the 3G related sales were
approximately 16% of Networks total sales. As 2003 was the first year of 3G volume roll-outs,
profitability of our infrastructure business was lower due to quality issues related to the new
technology. In 2004, 2G accounted for a higher proportion of total net sales than expected, with 3G
ultimately increasing its year-on-year share by 1% to 17%. Service related sales, such as roll-out,
maintenance and professional services, grew as a proportion of total sales throughout 2004,
closing the year at approximately 25%. In 2004, Networks entered several new geographical areas,
with the effect that initial roll-out profitability was negatively impacted by market entry related
costs as well as the highly competitive nature of these markets. However, overall profitability of
3G contracts positively impacted Networks’ profitability in 2004.
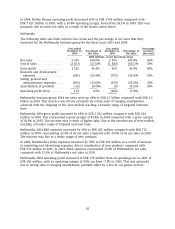
The following chart sets forth Nokia’s Networks net sales by geographic area for the three years
ended December 31, 2004.
53