Nokia 2004 Annual Report Download - page 176
Download and view the complete annual report
Please find page 176 of the 2004 Nokia annual report below. You can navigate through the pages in the report by either clicking on the pages listed below, or by using the keyword search tool below to find specific information within the annual report.-
 1
1 -
2
-
3
-
4
-
5
-
6
-
7
-
8
-
9
-
10
-
11
-
12
-
13
-
14
-
15
-
16
-
17
-
18
-
19
-
20
-
21
-
22
-
23
-
24
-
25
-
26
-
27
-
28
-
29
-
30
-
31
-
32
-
33
-
34
-
35
-
36
-
37
-
38
-
39
-
40
-
41
-
42
-
43
-
44
-
45
-
46
-
47
-
48
-
49
-
50
-
51
-
52
-
53
-
54
-
55
-
56
-
57
-
58
-
59
-
60
-
61
-
62
-
63
-
64
-
65
-
66
-
67
-
68
-
69
-
70
-
71
-
72
-
73
-
74
-
75
-
76
-
77
-
78
-
79
-
80
-
81
-
82
-
83
-
84
-
85
-
86
-
87
-
88
-
89
-
90
-
91
-
92
-
93
-
94
-
95
-
96
-
97
-
98
-
99
-
100
-
101
-
102
-
103
-
104
-
105
-
106
-
107
-
108
-
109
-
110
-
111
-
112
-
113
-
114
-
115
-
116
-
117
-
118
-
119
-
120
-
121
-
122
-
123
-
124
-
125
-
126
-
127
-
128
-
129
-
130
-
131
-
132
-
133
-
134
-
135
-
136
-
137
-
138
-
139
-
140
-
141
-
142
-
143
-
144
-
145
-
146
-
147
-
148
-
149
-
150
-
151
-
152
-
153
-
154
-
155
-
156
-
157
-
158
-
159
-
160
-
161
-
162
-
163
-
164
-
165
-
 166
166 -
 167
167 -
 168
168 -
 169
169 -
 170
170 -
 171
171 -
 172
172 -
 173
173 -
 174
174 -
 175
175 -
 176
176 -
 177
177 -
 178
178 -
 179
179 -
 180
180 -
 181
181 -
 182
182 -
 183
183 -
 184
184 -
 185
185 -
 186
186 -
187
-
188
-
189
-
190
-
191
-
192
-
193
-
194
-
195
 |
 |

Notes to the Consolidated Financial Statements (Continued)
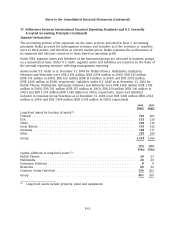
35. Risk management (Continued)
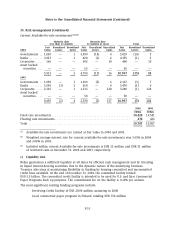
Current Available-for-sale investments(1)(2)(3)
Maturity date Maturity date
less than 12 months 12 months or more Total
Fair Unrealized Unrealized Fair Unrealized Unrealized Fair Unrealized Unrealized
2004 Value Losses Gains Value Losses Gains Value Losses Gains
Governments . . 1,820 — 1 3,999 (14) 4 5,819 (14) 5
Banks ........ 3,927 — 1 428 (1) 2 4,355 (1) 3
Corporates .... 166 — — 302 — 10 468 — 10
Asset backed
securities .... — — — 65 — — 65 — —
5,913 — 2 4,794 (15) 16 10,707 (15) 18
2003
Governments . . 1,058 — 1 1,109 (3) 6 2,167 (3) 7
Banks ........ 5,206 (1) 2 264 — 4 5,470 (1) 6
Corporates .... 2,165 — 1 1,115 — 128 3,280 (1) 128
Asset backed
securities .... — — — 50 — — 50 — —
8,430 (2) 4 2,538 (3) 137 10,967 (5) 141
2004 2003
EURm EURm
Fixed rate investments ............................................... 10,429 10,541
Floating rate investments ............................................. 278 426
Total ............................................................. 10,707 10,967
(1) Available-for-sale investments are carried at fair value in 2004 and 2003.
(2) Weighted average interest rate for current available-for-sale investments was 3.63% in 2004
and 3.08% in 2003.
(3) Included within current Available-for-sale investments is EUR 11 million and EUR 31 million
of restricted cash at December 31, 2004 and 2003, respectively.
c) Liquidity risk
Nokia guarantees a sufficient liquidity at all times by efficient cash management and by investing
in liquid interest-bearing securities. Due to the dynamic nature of the underlying business
Treasury also aims at maintaining flexibility in funding by keeping committed and uncommitted
credit lines available. At the end of December 31, 2004, the committed facility totaled
USD 2.0 billion. The committed credit facility is intended to be used for U.S. and Euro Commercial
Paper Programs back up purposes. The commitment fee on the facility is 0.10% per annum.
The most significant existing funding programs include:
Revolving Credit Facility of USD 2,000 million, maturing in 2008
Local commercial paper program in Finland, totaling EUR 750 million
F-51