Nokia 2004 Annual Report Download - page 52
Download and view the complete annual report
Please find page 52 of the 2004 Nokia annual report below. You can navigate through the pages in the report by either clicking on the pages listed below, or by using the keyword search tool below to find specific information within the annual report.-
 1
1 -
2
-
3
-
4
-
5
-
6
-
7
-
8
-
9
-
10
-
11
-
12
-
13
-
14
-
15
-
16
-
17
-
18
-
19
-
20
-
21
-
22
-
23
-
24
-
25
-
26
-
27
-
28
-
29
-
30
-
31
-
32
-
33
-
34
-
35
-
36
-
37
-
38
-
39
-
40
-
41
-
 42
42 -
 43
43 -
 44
44 -
 45
45 -
 46
46 -
 47
47 -
 48
48 -
 49
49 -
 50
50 -
 51
51 -
 52
52 -
 53
53 -
 54
54 -
 55
55 -
 56
56 -
 57
57 -
 58
58 -
 59
59 -
 60
60 -
 61
61 -
 62
62 -
63
-
64
-
65
-
66
-
67
-
68
-
69
-
70
-
71
-
72
-
73
-
74
-
75
-
76
-
77
-
78
-
79
-
80
-
81
-
82
-
83
-
84
-
85
-
86
-
87
-
88
-
89
-
90
-
91
-
92
-
93
-
94
-
95
-
96
-
97
-
98
-
99
-
100
-
101
-
102
-
103
-
104
-
105
-
106
-
107
-
108
-
109
-
110
-
111
-
112
-
113
-
114
-
115
-
116
-
117
-
118
-
119
-
120
-
121
-
122
-
123
-
124
-
125
-
126
-
127
-
128
-
129
-
130
-
131
-
132
-
133
-
134
-
135
-
136
-
137
-
138
-
139
-
140
-
141
-
142
-
143
-
144
-
145
-
146
-
147
-
148
-
149
-
150
-
151
-
152
-
153
-
154
-
155
-
156
-
157
-
158
-
159
-
160
-
161
-
162
-
163
-
164
-
165
-
166
-
167
-
168
-
169
-
170
-
171
-
172
-
173
-
174
-
175
-
176
-
177
-
178
-
179
-
180
-
181
-
182
-
183
-
184
-
185
-
186
-
187
-
188
-
189
-
190
-
191
-
192
-
193
-
194
-
195
 |
 |
•Mix shifts: In 2004 the share of first time buyers, new subscribers, was approximately 50%
of the global mobile device industry volume and in 2005 it is expected to diminish to
approximately 40%. In 2005 as in 2004, the new subscribers continue to come
predominantly from lower penetration countries and those who purchase lower priced
products. At the same time the replacement market, which on average is made up of more
expensive products, is increasing its share. Consumers upgrading to new features and
functionalities is one of the drivers for this market. For example, many of the developed
markets in 2004 were driven by upgrades to camera functionality and/or to a larger and
brighter color screen. In some cases the consumer benefits of the new product introductions
could be perceived so high, that the new feature introduction warrants a price premium.
•Price erosion: Price erosion is a normal characteristic of the mobile device industry. As a
consequence, the pricing for any given feature and functionality tends to decline over a
period of time. For example, prices of phones with simple mobile voice functionality as well
as lower resolution camera phones are declining, while the high end of the imaging market
is moving to one-megapixel and higher camera resolutions. Price erosion tends to be the
steepest when a feature enters the volume market phase.
•Industry competition: The overall industry competition, the balance between demand and
supply, also impacts the pricing. A severe oversupply tends to create pricing pressure, while
a balanced demand-supply situation supports more benign pricing.
The 2005 mobile device industry value development will ultimately depend on the customer and
product mix, price erosion associated with various features and functionalities, and the overall
demand-supply balance.
For Nokia, all the same industry factors—mix, price erosion and competitiveness—impact pricing.
To mitigate the impact of mix shifts on our profitability, we implement product segmentation,
with the aim of designing appropriate features with an appropriate cost basis for each customer
segment. Likewise, we endeavor to mitigate the impact on our profitability of price erosion of
certain features and functionalities by seeking to correctly time the introduction of new products,
in order to align such introductions with declines in the prices of relevant components.
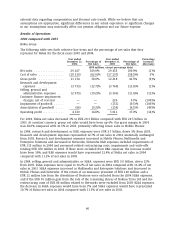
In 2004, Nokia’s ASP was EUR 110, declining by 17% from EUR 132 in 2003. In 2003, Nokia’s ASP
declined by 14% from EUR 153 in 2002. In 2004, Nokia’s ASP declined sequentially in each of the
first three quarters of the year due to the price reductions explained above. Nokia’s ASP declined
from EUR 127 (fourth quarter 2003) to EUR 115 (first quarter 2004) to EUR 111 (second quarter
2004) to EUR 106 (third quarter 2004). With the introduction of new products and improved
product mix during the latter part of 2004, our overall competitive position improved leading to a
sequential increase in Nokia’s ASP during the fourth quarter of 2004, to EUR 107. The introduction
of new products and improved product mix also contributed to our sequential market share
growth during the third and fourth quarters of 2004 to 33% and 34%, respectively. Nokia’s ASPs
have been calculated by dividing Nokia’s total mobile device net sales by mobile device volume.
Operational efficiency and cost control have been and will continue to be important factors
affecting our profitability and competitiveness. Our mobile device product costs are driven mainly
by cost of components, manufacturing labor, royalties, depreciation of product machinery, logistics
costs and warranty and other quality costs. In addition, we believe our annual sales volumes in
excess of 200 million units, approximately twice the volume of the nearest competitor, give us
sizeable scale benefits in component procurement as well as in absorbing research and
development, or R&D, and selling, general and administrative, or SG&A, costs.
We also believe that effective and efficient research and development is vital to remaining
competitive. For 2003 and 2004 research and development expenses represented approximately
51