Nokia 2004 Annual Report Download - page 69
Download and view the complete annual report
Please find page 69 of the 2004 Nokia annual report below. You can navigate through the pages in the report by either clicking on the pages listed below, or by using the keyword search tool below to find specific information within the annual report.-
 1
1 -
2
-
3
-
4
-
5
-
6
-
7
-
8
-
9
-
10
-
11
-
12
-
13
-
14
-
15
-
16
-
17
-
18
-
19
-
20
-
21
-
22
-
23
-
24
-
25
-
26
-
27
-
28
-
29
-
30
-
31
-
32
-
33
-
34
-
35
-
36
-
37
-
38
-
39
-
40
-
41
-
42
-
43
-
44
-
45
-
46
-
47
-
48
-
49
-
50
-
51
-
52
-
53
-
54
-
55
-
56
-
57
-
58
-
 59
59 -
 60
60 -
 61
61 -
 62
62 -
 63
63 -
 64
64 -
 65
65 -
 66
66 -
 67
67 -
 68
68 -
 69
69 -
 70
70 -
 71
71 -
 72
72 -
 73
73 -
 74
74 -
 75
75 -
 76
76 -
 77
77 -
 78
78 -
 79
79 -
80
-
81
-
82
-
83
-
84
-
85
-
86
-
87
-
88
-
89
-
90
-
91
-
92
-
93
-
94
-
95
-
96
-
97
-
98
-
99
-
100
-
101
-
102
-
103
-
104
-
105
-
106
-
107
-
108
-
109
-
110
-
111
-
112
-
113
-
114
-
115
-
116
-
117
-
118
-
119
-
120
-
121
-
122
-
123
-
124
-
125
-
126
-
127
-
128
-
129
-
130
-
131
-
132
-
133
-
134
-
135
-
136
-
137
-
138
-
139
-
140
-
141
-
142
-
143
-
144
-
145
-
146
-
147
-
148
-
149
-
150
-
151
-
152
-
153
-
154
-
155
-
156
-
157
-
158
-
159
-
160
-
161
-
162
-
163
-
164
-
165
-
166
-
167
-
168
-
169
-
170
-
171
-
172
-
173
-
174
-
175
-
176
-
177
-
178
-
179
-
180
-
181
-
182
-
183
-
184
-
185
-
186
-
187
-
188
-
189
-
190
-
191
-
192
-
193
-
194
-
195
 |
 |

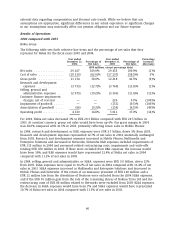
Nokia Mobile Phones operating profit increased by 5% to EUR 5 483 million in 2003 compared with
EUR 5 201 million in 2002. Nokia Mobile Phones operating margin improved to 23.2% in 2003,
from 22.4% in 2002. This improvement primarily came from lower product costs in 2003,
compared with 2002. Improved product quality and our product mix, which included more
lower-end, lower cost phones, as well as the depreciation of our main sourcing currencies, the
US dollar and the Japanese yen, were the main contributors to lower product costs.
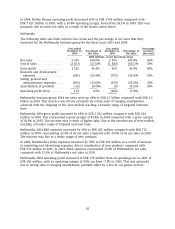
Nokia Networks
Nokia Networks Net Sales, Operating Profit and Operating Margin
Year ended Year ended Percentage
December 31, December 31, Increase/
2003 2002 (decrease)
(EUR millions, except percentage data)
Net sales ......................................... 5 620 6 539 (14%)
Operating profit ................................... (219) (49) (347%)
Operating margin (%) ............................... (3.9%) (0.7%)
Net sales of Nokia Networks decreased by 14% to EUR 5 620 million in 2003 compared with
EUR 6 539 million in 2002 due to an overall market decline. At constant currency, the net sales
decrease would have been 9%. Although sales grew in the Americas, this was more than offset by
lower sales in Europe, Middle-East & Africa and Asia-Pacific, compared with 2002.
During 2003, the mobile networks market declined by just over 15% in euro terms, according to
Nokia’s preliminary estimates, while network operators continued to focus on short-term cash
flow generation and debt reduction. Although 2003 marked the third consecutive year of decline
in the mobile networks market, encouraging signs in the fourth quarter indicated that the market
began to stabilize as the financial position of network operators improved. As well, during the
second half of 2003, operators began to reconfirm their commitment to 3G WCDMA, most notably
by renewing or continuing their network equipment supply agreements, and by accelerating the
deployment of the networks compared with 2002.
By the end of 2003, Nokia was a supplier to six of the world’s 12 commercially launched 3G
WCDMA networks and was rolling out 26 3G WCDMA networks in 15 countries. Altogether, Nokia
has 37 publicly announced 3G WCDMA deals.
In 2003, Nokia announced 18 GSM, GPRS or GSM/GPRS/EDGE deals in various parts of the world, in
addition to four EDGE deals in Latin America and Asia-Pacific. EDGE gained momentum during the
year and at year-end, Nokia was a supplier to nine of the 11 commercially launched EDGE
networks. This included a nationwide EDGE deployment and network opening with AT&T Wireless
in the United States.
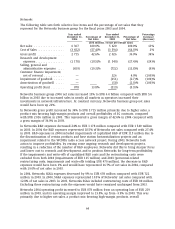
In 2003, Nokia Networks took action to improve profitability, by ceasing certain ongoing research
and development projects and reducing the number of its employees. Nokia Networks research
and development costs totaled EUR 1 540 million in 2003 (27.4% of Nokia Networks’ net sales).
These include restructuring costs of EUR 15 million relating to personnel reduction, impairments
(EUR 275 million) and write-offs (EUR 180 million) of capitalized R&D costs, totaling EUR 470
million. In 2002, Nokia Networks R&D costs were EUR 995 million (15.2% of Nokia Networks net
sales). If the restructuring costs, impairments and write-offs were excluded, R&D expenses would
have been 19.0% of net sales in 2003, representing growth in R&D expenses of 8% compared with
2002.
Selling and marketing expenses in Nokia Networks were EUR 476 million in 2003 (8.5% of Nokia
Networks net sales), compared with EUR 640 million (9.8% of Nokia Networks net sales) in 2002.
68