Nokia 2004 Annual Report Download - page 77
Download and view the complete annual report
Please find page 77 of the 2004 Nokia annual report below. You can navigate through the pages in the report by either clicking on the pages listed below, or by using the keyword search tool below to find specific information within the annual report.-
 1
1 -
2
-
3
-
4
-
5
-
6
-
7
-
8
-
9
-
10
-
11
-
12
-
13
-
14
-
15
-
16
-
17
-
18
-
19
-
20
-
21
-
22
-
23
-
24
-
25
-
26
-
27
-
28
-
29
-
30
-
31
-
32
-
33
-
34
-
35
-
36
-
37
-
38
-
39
-
40
-
41
-
42
-
43
-
44
-
45
-
46
-
47
-
48
-
49
-
50
-
51
-
52
-
53
-
54
-
55
-
56
-
57
-
58
-
59
-
60
-
61
-
62
-
63
-
64
-
65
-
66
-
 67
67 -
 68
68 -
 69
69 -
 70
70 -
 71
71 -
 72
72 -
 73
73 -
 74
74 -
 75
75 -
 76
76 -
 77
77 -
 78
78 -
 79
79 -
 80
80 -
 81
81 -
 82
82 -
 83
83 -
 84
84 -
 85
85 -
 86
86 -
 87
87 -
88
-
89
-
90
-
91
-
92
-
93
-
94
-
95
-
96
-
97
-
98
-
99
-
100
-
101
-
102
-
103
-
104
-
105
-
106
-
107
-
108
-
109
-
110
-
111
-
112
-
113
-
114
-
115
-
116
-
117
-
118
-
119
-
120
-
121
-
122
-
123
-
124
-
125
-
126
-
127
-
128
-
129
-
130
-
131
-
132
-
133
-
134
-
135
-
136
-
137
-
138
-
139
-
140
-
141
-
142
-
143
-
144
-
145
-
146
-
147
-
148
-
149
-
150
-
151
-
152
-
153
-
154
-
155
-
156
-
157
-
158
-
159
-
160
-
161
-
162
-
163
-
164
-
165
-
166
-
167
-
168
-
169
-
170
-
171
-
172
-
173
-
174
-
175
-
176
-
177
-
178
-
179
-
180
-
181
-
182
-
183
-
184
-
185
-
186
-
187
-
188
-
189
-
190
-
191
-
192
-
193
-
194
-
195
 |
 |
Please see Note 30 to our consolidated financial statements for further information regarding
commitments and contingencies.
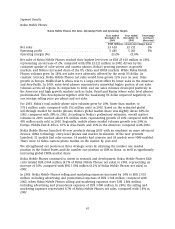
5.C Research and Development, Patents and Licenses
Success in the mobile communications industry requires continuous introduction of new products
and solutions based on the latest available technology. This places considerable demands on our
research and development activities. Consequently, in order to maintain our competitiveness, we
have made substantial research and development expenditures in each of the last three years. Our
consolidated research and development costs for 2004 were EUR 3 733 million, a decrease of 1%
from EUR 3 760 million in 2003 and an increase of 23% from EUR 3 052 million in 2002. These
costs represented 12.7%, 12.8% and 10.2% of net sales in 2004, 2003 and 2002, respectively. R&D
expenses increased in Mobile Phones, Multimedia and Enterprise Solutions and decreased in
Networks. R&D expenses in 2004 included impairments of EUR 115 million in Networks due to the
discontinuation of certain products and base station horizontalization projects and an impairment
related to the WCDMA radio access network project. During 2003, Networks took action to improve
profitability by ceasing certain ongoing research and development projects, resulting in a
reduction of the number of R&D employees. Networks did this to bring sharper focus and lower
cost to research and development, and to position Networks for long-term profitability. If the
impairments and write-offs of capitalized R&D costs and the restructuring costs in Networks were
excluded from both the 2004 (impairments of EUR 115 million) and 2003 (personnel-related
restructuring costs, impairments and write-offs totaling EUR 470 million), the increase in R&D
expenses would have been 10% and would have represented 12.4% of Nokia net sales in 2004,
compared with 11.2% of net sales in 2003.
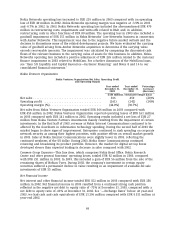
To enable our future growth, we continued to invest in our worldwide research and development
network, as well as increasing our collaboration with third parties. At December 31, 2004, we
employed 20 722 people in research and development, representing approximately 37% of Nokia’s
total workforce, and had research and development in 12 countries. Research and development
expenses of Mobile Phones as a percentage of its net sales were 6.4% in 2004 compared with 4.9%
in 2003. In Multimedia research and development expenses as a percentage of its net sales were
23.4% in 2004 compared with 29.0% in 2003. Research and development expenses of Enterprise
Solutions as a percentage of its net sales were 35.9%, compared with 44.4% in 2003. In the case of
Networks, research and development costs represented 18.5%, 27.4% and 15.2% of its net sales in
2004, 2003 and 2002, respectively. If the impairments and write-offs of capitalized R&D costs and
restructuring costs described in the previous paragraph were excluded, the R&D costs of Networks
would have represented 16.7% and 19.0% of Networks’ net sales in 2004 and 2003, respectively.
See ‘‘Item 4.B Business Overview—Technology, Research and Development’’ and ‘‘—Patents and
Licenses.’’
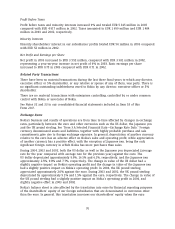
We are reviewing our R&D activities in order to get the most compelling products to market at the
right time, and we are aiming to lower our R&D expenses/net sales ratio while remaining effective
and focused in our efforts. This will require focused R&D spend and a re-engineered product
creation process intended to reduce product development cycle times. As a part of this activity, we
announced in January 2005 that we are streamlining our Multimedia research and development
activities and this has been leading to restructuring of the R&D activities in the games business
unit. Our target is to bring overall Nokia R&D expenditure down to 9%-10% of net sales by the end
of 2006. In accordance with this plan, we have set as a target that by the end of 2006 the R&D
expenses/net sales ratio of our mobile devices business would be 8% and 14% for our
infrastructure business.
76