Nokia 2004 Annual Report Download - page 68
Download and view the complete annual report
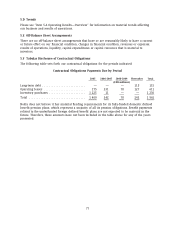
Please find page 68 of the 2004 Nokia annual report below. You can navigate through the pages in the report by either clicking on the pages listed below, or by using the keyword search tool below to find specific information within the annual report.-
 1
1 -
2
-
3
-
4
-
5
-
6
-
7
-
8
-
9
-
10
-
11
-
12
-
13
-
14
-
15
-
16
-
17
-
18
-
19
-
20
-
21
-
22
-
23
-
24
-
25
-
26
-
27
-
28
-
29
-
30
-
31
-
32
-
33
-
34
-
35
-
36
-
37
-
38
-
39
-
40
-
41
-
42
-
43
-
44
-
45
-
46
-
47
-
48
-
49
-
50
-
51
-
52
-
53
-
54
-
55
-
56
-
57
-
 58
58 -
 59
59 -
 60
60 -
 61
61 -
 62
62 -
 63
63 -
 64
64 -
 65
65 -
 66
66 -
 67
67 -
 68
68 -
 69
69 -
 70
70 -
 71
71 -
 72
72 -
 73
73 -
 74
74 -
 75
75 -
 76
76 -
 77
77 -
 78
78 -
79
-
80
-
81
-
82
-
83
-
84
-
85
-
86
-
87
-
88
-
89
-
90
-
91
-
92
-
93
-
94
-
95
-
96
-
97
-
98
-
99
-
100
-
101
-
102
-
103
-
104
-
105
-
106
-
107
-
108
-
109
-
110
-
111
-
112
-
113
-
114
-
115
-
116
-
117
-
118
-
119
-
120
-
121
-
122
-
123
-
124
-
125
-
126
-
127
-
128
-
129
-
130
-
131
-
132
-
133
-
134
-
135
-
136
-
137
-
138
-
139
-
140
-
141
-
142
-
143
-
144
-
145
-
146
-
147
-
148
-
149
-
150
-
151
-
152
-
153
-
154
-
155
-
156
-
157
-
158
-
159
-
160
-
161
-
162
-
163
-
164
-
165
-
166
-
167
-
168
-
169
-
170
-
171
-
172
-
173
-
174
-
175
-
176
-
177
-
178
-
179
-
180
-
181
-
182
-
183
-
184
-
185
-
186
-
187
-
188
-
189
-
190
-
191
-
192
-
193
-
194
-
195
 |
 |

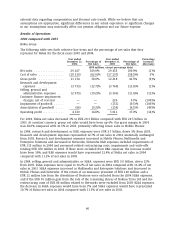
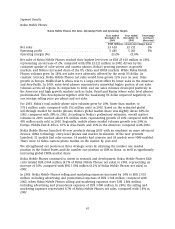
Segment Results
Nokia Mobile Phones
Nokia Mobile Phones Net Sales, Operating Profit and Operating Margin
Year ended Year ended Percentage
December 31, December 31, Increase/
2003 2002 (decrease)
(EUR millions, except percentage data)
Net sales ......................................... 23 618 23 211 2%
Operating profit ................................... 5 483 5 201 5%
Operating margin (%) ............................... 23.2% 22.4%
Net sales of Nokia Mobile Phones reached their highest level ever at EUR 23 618 million in 2003,
representing an increase of 2%, compared with EUR 23 211 million in 2002, driven by the
consumer uptake of color-screen and camera phones, Nokia’s growing presence in growth
markets, and Nokia’s increased share of the US, China and CDMA markets. While Nokia Mobile
Phones volumes grew by 18%, net sales were adversely affected by the weak US dollar. At
constant currency, Nokia Mobile Phones net sales would have grown 12% year on year. Sales
growth in Europe, Middle-East & Africa was to a large extent offset by lower sales in the Americas
and Asia-Pacific. In 2003, entry-level phones represented a somewhat higher portion of our sales
volumes across all regions in comparison to 2002, and our sales volumes developed positively in
the Americas and high growth markets such as India, Brazil and Russia where entry level phones
predominated. This development together with the weakening US dollar impacted negatively on
our average selling price per phone and net sales.
For 2003, Nokia’s total mobile phone sales volumes grew by 18%, faster than market, to
179.3 million units, compared with 152 million units in 2002. Based on the estimated global
sell-through market for mobile phones, Nokia’s global market share was slightly above 38% for
2003, compared with 38% in 2002. According to Nokia’s preliminary estimates, overall market
volumes in 2003 reached about 471 million units, representing growth of 16% compared with the
405 million units sold in 2002. Regionally, mobile phone market volumes growth was 20% in
Europe, Middle-East & Africa, 15% in Asia-Pacific and 13% in the Americas, compared with 2002.
Nokia Mobile Phones launched 40 new products during 2003 with an emphasis on more advanced
devices, CDMA technology, entry-level phones and market localization. Of the new products
launched, 31 models had color-screens, 14 models had cameras and 24 models were MMS-enabled.
There were 12 Nokia camera phone models on the market by year-end.
We strengthened our position in three strategic areas by attaining the number one market
position in the United States and the number one position in GSM in China, as well as significantly
increasing global CDMA market share.
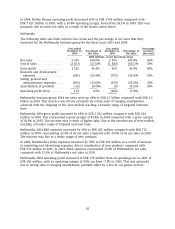
Nokia Mobile Phones continued to invest in research and development. Nokia Mobile Phones R&D
costs totaled EUR 2 064 million (8.7% of Nokia Mobile Phones net sales) in 2003, representing an
increase of 10%, compared with EUR 1 884 million (8.1% of Nokia Mobile Phones net sales) in
2002.
In 2003, Nokia Mobile Phones selling and marketing expenses increased by 14% to EUR 2 053
million, including advertising and promotional expenses of EUR 1 368 million, compared with
2002, when Nokia Mobile Phones selling and marketing expenses were EUR 1 804 million,
including advertising and promotional expenses of EUR 1 080 million. In 2003, the selling and
marketing expenses represented 8.7% of Nokia Mobile Phones net sales, compared with 7.8% in
2002.
67