Nokia 2004 Annual Report Download - page 101
Download and view the complete annual report
Please find page 101 of the 2004 Nokia annual report below. You can navigate through the pages in the report by either clicking on the pages listed below, or by using the keyword search tool below to find specific information within the annual report.-
 1
1 -
2
-
3
-
4
-
5
-
6
-
7
-
8
-
9
-
10
-
11
-
12
-
13
-
14
-
15
-
16
-
17
-
18
-
19
-
20
-
21
-
22
-
23
-
24
-
25
-
26
-
27
-
28
-
29
-
30
-
31
-
32
-
33
-
34
-
35
-
36
-
37
-
38
-
39
-
40
-
41
-
42
-
43
-
44
-
45
-
46
-
47
-
48
-
49
-
50
-
51
-
52
-
53
-
54
-
55
-
56
-
57
-
58
-
59
-
60
-
61
-
62
-
63
-
64
-
65
-
66
-
67
-
68
-
69
-
70
-
71
-
72
-
73
-
74
-
75
-
76
-
77
-
78
-
79
-
80
-
81
-
82
-
83
-
84
-
85
-
86
-
87
-
88
-
89
-
90
-
 91
91 -
 92
92 -
 93
93 -
 94
94 -
 95
95 -
 96
96 -
 97
97 -
 98
98 -
 99
99 -
 100
100 -
 101
101 -
 102
102 -
 103
103 -
 104
104 -
 105
105 -
 106
106 -
 107
107 -
 108
108 -
 109
109 -
 110
110 -
 111
111 -
112
-
113
-
114
-
115
-
116
-
117
-
118
-
119
-
120
-
121
-
122
-
123
-
124
-
125
-
126
-
127
-
128
-
129
-
130
-
131
-
132
-
133
-
134
-
135
-
136
-
137
-
138
-
139
-
140
-
141
-
142
-
143
-
144
-
145
-
146
-
147
-
148
-
149
-
150
-
151
-
152
-
153
-
154
-
155
-
156
-
157
-
158
-
159
-
160
-
161
-
162
-
163
-
164
-
165
-
166
-
167
-
168
-
169
-
170
-
171
-
172
-
173
-
174
-
175
-
176
-
177
-
178
-
179
-
180
-
181
-
182
-
183
-
184
-
185
-
186
-
187
-
188
-
189
-
190
-
191
-
192
-
193
-
194
-
195
 |
 |
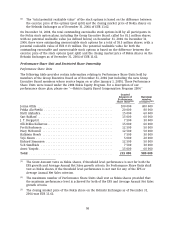
preceding the disclosure of our annual results. In addition, company may set trading restrictions
based on project participation. We update our insider trading policy from time to time and
monitor our insiders’ compliance with the policy on a regular basis. Nokia’s Insider Policy is in
line with the Helsinki Exchanges Guidelines for Insiders and also sets requirements beyond these
guidelines.
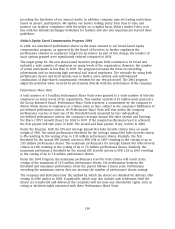
Nokia’s Equity Based Compensation Program 2004
In 2004, we introduced performance shares as the main element to our broad-based equity
compensation program, as approved by the Board of Directors, to further emphasize the
performance element in employees’ long-term incentives. As part of this change, the number of
stock options granted were significantly reduced compared to 2003.
The target group for the new share-based incentive program 2004 continued to be broad and
included a wide number of employees on many levels of the organization. However, the number
of actual participants is less than in 2003. The program increased the focus on rewarding
achievement and on retaining high potential and critical employees. The rationale for using both
performance shares and stock options was to build a more optimal and well-balanced
combination of share-based compensation elements for our reward model. The 2004 program
aligns the potential value received by participants directly with the performance of the company.
Performance Share Units
A total number of 3.9 million Performance Share Units were granted to a wide number of selected
employees on many levels of the organization. This number includes 0.25 million units granted to
the Group Executive Board. Performance Share Units represent a commitment by the company to
deliver Nokia shares to employees at a future point in time, subject to the company’s fulfillment of
pre-defined performance criteria. No Performance Share Units will vest unless the company
performance reaches at least one of the threshold levels measured by two independent,
pre-defined performance criteria: the company’s Average Annual Net Sales Growth and Earnings
Per Share (‘‘EPS’’) Growth (basic) for 2004 to 2007. If the required performance level is achieved,
the first payout will take place in 2006. The second and final payout, if any, will be in 2008.
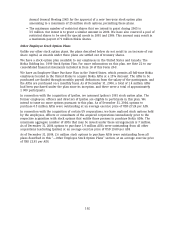
Under the Program, both the EPS and Average Annual Net Sales Growth criteria have an equal
weight of 50%. The initial performance threshold for the Average Annual Net Sales Growth criteria
is 4% resulting in the vesting of up to 1.95 million performance shares. Similarly, the first
threshold for the annual EPS Growth criteria is EUR 0.84 in 2007 resulting in the vesting of up to
1.95 million performance shares. The maximum performance for Average Annual Net Sales Growth
criteria is 16% resulting in the vesting of up to 7.8 million performance shares. Similarly, the
maximum performance threshold for the annual EPS Growth criteria is EUR 1.18 in 2007 resulting
in the vesting of up to 7.8 million performance shares.
Under the 2004 Program, the maximum performance level for both criteria will result in the
vesting of the maximum of 15.6 million performance shares. For performance between the
threshold and maximum performance levels the payout follows a linear scale. Performance
exceeding the maximum criteria does not increase the number of performance shares vesting.
The company will determine later the method by which the shares are obtained for delivery after
vesting in 2006 and/or in 2008, if applicable, which may also include cash settlement. Until the
shares are transferred and delivered, the recipients will not have any shareholder rights, such as
voting or dividend rights associated with these Performance Share Units.
100