Nokia 2004 Annual Report Download - page 144
Download and view the complete annual report
Please find page 144 of the 2004 Nokia annual report below. You can navigate through the pages in the report by either clicking on the pages listed below, or by using the keyword search tool below to find specific information within the annual report.-
 1
1 -
2
-
3
-
4
-
5
-
6
-
7
-
8
-
9
-
10
-
11
-
12
-
13
-
14
-
15
-
16
-
17
-
18
-
19
-
20
-
21
-
22
-
23
-
24
-
25
-
26
-
27
-
28
-
29
-
30
-
31
-
32
-
33
-
34
-
35
-
36
-
37
-
38
-
39
-
40
-
41
-
42
-
43
-
44
-
45
-
46
-
47
-
48
-
49
-
50
-
51
-
52
-
53
-
54
-
55
-
56
-
57
-
58
-
59
-
60
-
61
-
62
-
63
-
64
-
65
-
66
-
67
-
68
-
69
-
70
-
71
-
72
-
73
-
74
-
75
-
76
-
77
-
78
-
79
-
80
-
81
-
82
-
83
-
84
-
85
-
86
-
87
-
88
-
89
-
90
-
91
-
92
-
93
-
94
-
95
-
96
-
97
-
98
-
99
-
100
-
101
-
102
-
103
-
104
-
105
-
106
-
107
-
108
-
109
-
110
-
111
-
112
-
113
-
114
-
115
-
116
-
117
-
118
-
119
-
120
-
121
-
122
-
123
-
124
-
125
-
126
-
127
-
128
-
129
-
130
-
131
-
132
-
133
-
 134
134 -
 135
135 -
 136
136 -
 137
137 -
 138
138 -
 139
139 -
 140
140 -
 141
141 -
 142
142 -
 143
143 -
 144
144 -
 145
145 -
 146
146 -
 147
147 -
 148
148 -
 149
149 -
 150
150 -
 151
151 -
 152
152 -
 153
153 -
 154
154 -
155
-
156
-
157
-
158
-
159
-
160
-
161
-
162
-
163
-
164
-
165
-
166
-
167
-
168
-
169
-
170
-
171
-
172
-
173
-
174
-
175
-
176
-
177
-
178
-
179
-
180
-
181
-
182
-
183
-
184
-
185
-
186
-
187
-
188
-
189
-
190
-
191
-
192
-
193
-
194
-
195
 |
 |

Notes to the Consolidated Financial Statements (Continued)
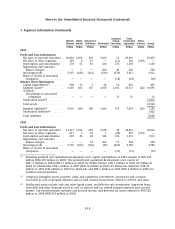
3. Segment information (Continued)
Common Total
Mobile Multi- Enterprise Group reportable Elimi-
Phones media Solutions Networks Functions segments nations Group
EURm EURm EURm EURm EURm EURm EURm EURm
2003
Profit and Loss Information
Net sales to external customers . . 20,826 2,496 502 5,620 11 29,455 29,455
Net sales to other segments ..... 125 8 27 — (11) 149 (149) —
Depreciation and amortization . . 378 55 10 520 175 1,138 1,138
Impairment and customer
finance charges ............ — — — 200 40 240 240
Operating profit ............. 5,927 (186) (141) (219) (370) 5,011 5,011
Share of results of associated
companies ................ — — — — (18) (18) (18)
Balance Sheet Information
Capital expenditures(1) ......... 298 33 3 44 54 432 432
Segment assets(2) ............. 4,169 604 135 4,108 1,101 10,117 (22) 10,095
of which:
Investments in associated
companies .............. — — — — 76 76 76
Unallocated assets(3) .......... 13,825
Total assets ................. 23,920
Segment liabilities(4) .......... 4,532 689 180 1,628 178 7,207 (22) 7,185
Unallocated liabilities(5) ........ 1,423
Total liabilities .............. 8,608
2002
Profit and Loss Information
Net sales to external customers . . 21,417 1,552 469 6,538 40 30,016 30,016
Net sales to other segments ..... 211 3 18 1 (40) 193 (193) —
Depreciation and amortization . . 501 46 28 542 194 1,311 1,311
Impairment and customer
finance charges ............ — — 61 400 77 538 538
Operating profit ............. 5,718 (365) (102) (49) (422) 4,780 4,780
Share of results of associated
companies ................ — — — — (19) (19) (19)
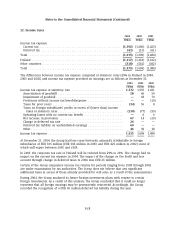
(1) Including goodwill and capitalized development costs, capital expenditures in 2004 amount to EUR 649
million (EUR 670 million in 2003). The goodwill and capitalized development costs consist of
EUR 11 million in 2004 (EUR 17 million in 2003) for Mobile Phones, EUR 3 million in 2004 (12 million in
2003) for Multimedia, EUR 1 million in 2004 (EUR 22 million in 2003) for Enterprise Solutions, EUR 83
million in 2004 (182 million in 2003) for Networks and EUR 3 million in 2004 (EUR 5 million in 2003) for
Common Group Functions.
(2) Comprises intangible assets, property, plant and equipment, investments, inventories and accounts
receivable as well as prepaid expenses and accrued income except those related to interest and taxes.
(3) Unallocated assets include cash and other liquid assets, available-for-sale investments, long-term loans
receivable and other financial assets as well as interest and tax related prepaid expenses and accrued
income. Tax related prepaid expenses and accrued income, and deferred tax assets amount to EUR 826
million in 2004 (EUR 834 million in 2003).
F-19