Nokia 2004 Annual Report Download - page 12
Download and view the complete annual report
Please find page 12 of the 2004 Nokia annual report below. You can navigate through the pages in the report by either clicking on the pages listed below, or by using the keyword search tool below to find specific information within the annual report.-
 1
1 -
 2
2 -
 3
3 -
 4
4 -
 5
5 -
 6
6 -
 7
7 -
 8
8 -
 9
9 -
 10
10 -
 11
11 -
 12
12 -
 13
13 -
 14
14 -
 15
15 -
 16
16 -
 17
17 -
 18
18 -
 19
19 -
 20
20 -
 21
21 -
 22
22 -
23
-
24
-
25
-
26
-
27
-
28
-
29
-
30
-
31
-
32
-
33
-
34
-
35
-
36
-
37
-
38
-
39
-
40
-
41
-
42
-
43
-
44
-
45
-
46
-
47
-
48
-
49
-
50
-
51
-
52
-
53
-
54
-
55
-
56
-
57
-
58
-
59
-
60
-
61
-
62
-
63
-
64
-
65
-
66
-
67
-
68
-
69
-
70
-
71
-
72
-
73
-
74
-
75
-
76
-
77
-
78
-
79
-
80
-
81
-
82
-
83
-
84
-
85
-
86
-
87
-
88
-
89
-
90
-
91
-
92
-
93
-
94
-
95
-
96
-
97
-
98
-
99
-
100
-
101
-
102
-
103
-
104
-
105
-
106
-
107
-
108
-
109
-
110
-
111
-
112
-
113
-
114
-
115
-
116
-
117
-
118
-
119
-
120
-
121
-
122
-
123
-
124
-
125
-
126
-
127
-
128
-
129
-
130
-
131
-
132
-
133
-
134
-
135
-
136
-
137
-
138
-
139
-
140
-
141
-
142
-
143
-
144
-
145
-
146
-
147
-
148
-
149
-
150
-
151
-
152
-
153
-
154
-
155
-
156
-
157
-
158
-
159
-
160
-
161
-
162
-
163
-
164
-
165
-
166
-
167
-
168
-
169
-
170
-
171
-
172
-
173
-
174
-
175
-
176
-
177
-
178
-
179
-
180
-
181
-
182
-
183
-
184
-
185
-
186
-
187
-
188
-
189
-
190
-
191
-
192
-
193
-
194
-
195
 |
 |

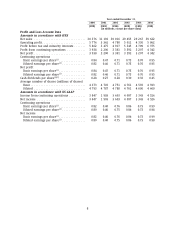
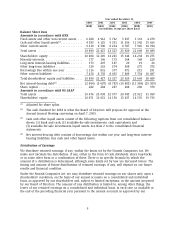
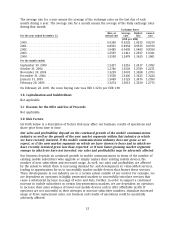
for 2000-2003, the dividend per share amounts have been translated into US dollars at the noon
buying rate on the respective dividend payment dates.
EUR millions
EUR per share USD per ADS (in total)
2000 ............................. 0.28 0.25 1 315
2001 ............................. 0.27 0.24 1 279
2002 ............................. 0.28 0.30 1 341
2003 ............................. 0.30 0.30 1 439
2004 ............................. 0.33(1) —(2) 1 539(1)
(1) To be proposed by the Board of Directors for approval at the Annual General Meeting
convening on April 7, 2005.
(2) The final US dollar amount will be determined on the basis of the decision of the Annual
General Meeting and the dividend payment date.
In 2000, we effected a four-for-one share split, effective in public trading on April 10, 2000. In the
table above, the dividend per share and dividend per ADS figures have been adjusted accordingly.
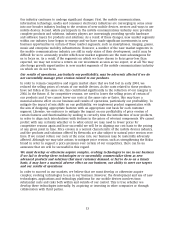
We make our cash dividend payments in euro. As a result, exchange rate fluctuations will affect
the US dollar amount received by holders of ADSs on conversion of these dividends. Moreover,
fluctuations in the exchange rates between the euro and the US dollar will affect the dollar
equivalent of the euro price of the shares on the Helsinki Exchanges and, as a result, are likely to
affect the market price of the ADSs in the United States. See also ‘‘Item 3.D Risk Factors—Our sales,
costs and results are affected by exchange rate fluctuations, particularly between the euro, which
is our reporting currency, and the US dollar, the UK pound sterling and the Japanese yen as well
as certain other currencies.’’
Exchange Rate Data
The following table sets forth information concerning the noon buying rate in New York City for
cable transfers as certified for customs purposes by the Federal Reserve Bank of New York for euro
for the years 2000 through 2004 and for each of the months in the six-month period ended
February 28, 2005, expressed in US dollars per euro.
11