Nokia 2004 Annual Report Download - page 116
Download and view the complete annual report
Please find page 116 of the 2004 Nokia annual report below. You can navigate through the pages in the report by either clicking on the pages listed below, or by using the keyword search tool below to find specific information within the annual report.-
 1
1 -
2
-
3
-
4
-
5
-
6
-
7
-
8
-
9
-
10
-
11
-
12
-
13
-
14
-
15
-
16
-
17
-
18
-
19
-
20
-
21
-
22
-
23
-
24
-
25
-
26
-
27
-
28
-
29
-
30
-
31
-
32
-
33
-
34
-
35
-
36
-
37
-
38
-
39
-
40
-
41
-
42
-
43
-
44
-
45
-
46
-
47
-
48
-
49
-
50
-
51
-
52
-
53
-
54
-
55
-
56
-
57
-
58
-
59
-
60
-
61
-
62
-
63
-
64
-
65
-
66
-
67
-
68
-
69
-
70
-
71
-
72
-
73
-
74
-
75
-
76
-
77
-
78
-
79
-
80
-
81
-
82
-
83
-
84
-
85
-
86
-
87
-
88
-
89
-
90
-
91
-
92
-
93
-
94
-
95
-
96
-
97
-
98
-
99
-
100
-
101
-
102
-
103
-
104
-
105
-
 106
106 -
 107
107 -
 108
108 -
 109
109 -
 110
110 -
 111
111 -
 112
112 -
 113
113 -
 114
114 -
 115
115 -
 116
116 -
 117
117 -
 118
118 -
 119
119 -
 120
120 -
 121
121 -
 122
122 -
 123
123 -
 124
124 -
 125
125 -
 126
126 -
127
-
128
-
129
-
130
-
131
-
132
-
133
-
134
-
135
-
136
-
137
-
138
-
139
-
140
-
141
-
142
-
143
-
144
-
145
-
146
-
147
-
148
-
149
-
150
-
151
-
152
-
153
-
154
-
155
-
156
-
157
-
158
-
159
-
160
-
161
-
162
-
163
-
164
-
165
-
166
-
167
-
168
-
169
-
170
-
171
-
172
-
173
-
174
-
175
-
176
-
177
-
178
-
179
-
180
-
181
-
182
-
183
-
184
-
185
-
186
-
187
-
188
-
189
-
190
-
191
-
192
-
193
-
194
-
195
 |
 |

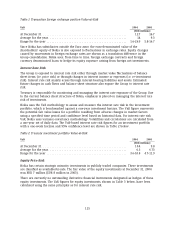
Table 1 Transaction foreign exchange position Value-at-Risk
VaR 2004 2003
(EUR millions)
At December 31 .................................................. 12.7 16.7
Average for the year ............................................... 14 9.3
Range for the year ................................................ 1.6-26.9 5.8-16.7
Since Nokia has subsidiaries outside the Euro zone, the euro-denominated value of the
shareholders’ equity of Nokia is also exposed to fluctuations in exchange rates. Equity changes
caused by movements in foreign exchange rates are shown as a translation difference in the
Group consolidation. Nokia uses, from time to time, foreign exchange contracts and foreign
currency denominated loans to hedge its equity exposure arising from foreign net investments.
Interest Rate Risk
The Group is exposed to interest rate risk either through market value fluctuations of balance
sheet items (i.e. price risk) or through changes in interest income or expenses (i.e. re-investment
risk). Interest rate risk mainly arises through interest-bearing liabilities and assets. Estimated
future changes in cash flows and balance sheet structure also expose the Group to interest rate
risk.
Treasury is responsible for monitoring and managing the interest rate exposure of the Group. Due
to the current balance sheet structure of Nokia, emphasis is placed on managing the interest rate
risk of investments.
Nokia uses the VaR methodology to assess and measure the interest rate risk in the investment
portfolio, which is benchmarked against a one-year investment horizon. The VaR figure represents
the potential fair value losses for a portfolio resulting from adverse changes in market factors
using a specified time period and confidence level based on historical data. For interest rate risk
VaR, Nokia uses variance-covariance methodology. Volatilities and correlations are calculated from
a one-year set of daily data. The VaR-based interest rate risk figures for an investment portfolio
with a one-week horizon and 95% confidence level are shown in Table 2 below.
Table 2 Treasury investment portfolio Value-at-Risk
VaR 2004 2003
(EUR millions)
At December 31 .................................................. 10.4 9.8
Average for the year ............................................... 6.3 6.73
Range for the year ................................................ 3.6-10.8 4.7-11.9
Equity Price Risk
Nokia has certain strategic minority investments in publicly traded companies. These investments
are classified as available-for-sale. The fair value of the equity investments at December 31, 2004
was EUR 7 million (EUR 8 million in 2003).
There are currently no outstanding derivative financial instruments designated as hedges of these
equity investments. The VaR figures for equity investments, shown in Table 3 below, have been
calculated using the same principles as for interest rate risk.
115