Nokia 2004 Annual Report Download - page 61
Download and view the complete annual report
Please find page 61 of the 2004 Nokia annual report below. You can navigate through the pages in the report by either clicking on the pages listed below, or by using the keyword search tool below to find specific information within the annual report.-
 1
1 -
2
-
3
-
4
-
5
-
6
-
7
-
8
-
9
-
10
-
11
-
12
-
13
-
14
-
15
-
16
-
17
-
18
-
19
-
20
-
21
-
22
-
23
-
24
-
25
-
26
-
27
-
28
-
29
-
30
-
31
-
32
-
33
-
34
-
35
-
36
-
37
-
38
-
39
-
40
-
41
-
42
-
43
-
44
-
45
-
46
-
47
-
48
-
49
-
50
-
 51
51 -
 52
52 -
 53
53 -
 54
54 -
 55
55 -
 56
56 -
 57
57 -
 58
58 -
 59
59 -
 60
60 -
 61
61 -
 62
62 -
 63
63 -
 64
64 -
 65
65 -
 66
66 -
 67
67 -
 68
68 -
 69
69 -
 70
70 -
 71
71 -
72
-
73
-
74
-
75
-
76
-
77
-
78
-
79
-
80
-
81
-
82
-
83
-
84
-
85
-
86
-
87
-
88
-
89
-
90
-
91
-
92
-
93
-
94
-
95
-
96
-
97
-
98
-
99
-
100
-
101
-
102
-
103
-
104
-
105
-
106
-
107
-
108
-
109
-
110
-
111
-
112
-
113
-
114
-
115
-
116
-
117
-
118
-
119
-
120
-
121
-
122
-
123
-
124
-
125
-
126
-
127
-
128
-
129
-
130
-
131
-
132
-
133
-
134
-
135
-
136
-
137
-
138
-
139
-
140
-
141
-
142
-
143
-
144
-
145
-
146
-
147
-
148
-
149
-
150
-
151
-
152
-
153
-
154
-
155
-
156
-
157
-
158
-
159
-
160
-
161
-
162
-
163
-
164
-
165
-
166
-
167
-
168
-
169
-
170
-
171
-
172
-
173
-
174
-
175
-
176
-
177
-
178
-
179
-
180
-
181
-
182
-
183
-
184
-
185
-
186
-
187
-
188
-
189
-
190
-
191
-
192
-
193
-
194
-
195
 |
 |

external data regarding compensation and discount rate trends. While we believe that our
assumptions are appropriate, significant differences in our actual experience or significant changes
in our assumptions may materially affect our pension obligation and our future expense.
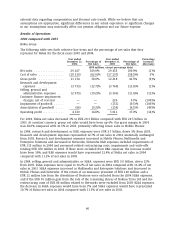
Results of Operations
2004 compared with 2003
Nokia Group
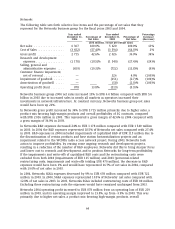
The following table sets forth selective line items and the percentage of net sales that they
represent for Nokia for the fiscal years 2003 and 2004.
Year ended Year ended Percentage
December 31, Percentage of December 31, Percentage of Increase/
2004 Net Sales 2003 Net Sales (decrease)
(EUR millions, except percentage data)
Net sales .................. 29 267 100.0% 29 455 100.0% (1)%
Cost of sales ................ (18 133) (62.0)% (17 237) (58.5)% 5%
Gross profit ................ 11 134 38.0% 12 218 41.5% (9)%
Research and development
expenses ................. (3 733) (12.7)% (3 760) (12.8)% (1)%
Selling, general and
administrative expenses .... (2 975) (10.2)% (3 363) (11.4)% (12)%
Customer finance impairment
charges, net of reversal ..... — — 226 0.7% (100)%
Impairment of goodwill ...... — — (151) (0.5)% (100)%
Amortization of goodwill ..... (96) (0.3)% (159) (0.5)% (40)%
Operating profit ............. 4 330 14.8% 5 011 17.0% (14)%
For 2004, Nokia net sales decreased 1% to EUR 29.3 billion compared with EUR 29.5 billion in
2003. At constant currency, group net sales would have been up 6%. Our gross margin in 2004
was 38.0% compared with 41.5% in 2003, primarily reflecting lower sales in Mobile Phones.
In 2004, research and development, or R&D, expenses were EUR 3.7 billion, down 1% from 2003.
Research and development expenses represented 12.7% of net sales in 2004, materially unchanged
from 2003. Research and development expenses increased in Mobile Phones, Multimedia and
Enterprise Solutions and decreased in Networks. Networks R&D expenses included impairments of
EUR 115 million in 2004 and personnel-related restructuring costs, impairments and write-offs
totaling EUR 470 million in 2003. If these were excluded from R&D expenses, the increase would
have been 10%, and R&D expenses would have represented 12.4% of Nokia net sales in 2004
compared with 11.2% of net sales in 2003.
In 2004, selling, general and administrative, or SG&A, expenses were EUR 3.0 billion, down 12%
from 2003. SG&A expenses were equal to 10.2% of net sales in 2004 compared with 11.4% of net
sales in 2003. SG&A expenses increased in Multimedia and Enterprise Solutions and decreased in
Mobile Phones and Networks. If the return of an insurance premium of EUR 160 million and a
EUR 12 million loss from the divestiture of Nextrom were excluded from the 2004 SG&A expenses,
and if the EUR 56 million gain from the sale of the remaining shares of Nokian Tyres Ltd and the
restructuring costs of EUR 80 million related to Networks were excluded from 2003 SG&A expenses,
the decrease in SG&A expenses would have been 7% and SG&A expenses would have represented
10.7% of Nokia net sales in 2004 compared with 11.3% of net sales in 2003.
60