Nokia 2004 Annual Report Download - page 53
Download and view the complete annual report
Please find page 53 of the 2004 Nokia annual report below. You can navigate through the pages in the report by either clicking on the pages listed below, or by using the keyword search tool below to find specific information within the annual report.-
 1
1 -
2
-
3
-
4
-
5
-
6
-
7
-
8
-
9
-
10
-
11
-
12
-
13
-
14
-
15
-
16
-
17
-
18
-
19
-
20
-
21
-
22
-
23
-
24
-
25
-
26
-
27
-
28
-
29
-
30
-
31
-
32
-
33
-
34
-
35
-
36
-
37
-
38
-
39
-
40
-
41
-
42
-
 43
43 -
 44
44 -
 45
45 -
 46
46 -
 47
47 -
 48
48 -
 49
49 -
 50
50 -
 51
51 -
 52
52 -
 53
53 -
 54
54 -
 55
55 -
 56
56 -
 57
57 -
 58
58 -
 59
59 -
 60
60 -
 61
61 -
 62
62 -
 63
63 -
64
-
65
-
66
-
67
-
68
-
69
-
70
-
71
-
72
-
73
-
74
-
75
-
76
-
77
-
78
-
79
-
80
-
81
-
82
-
83
-
84
-
85
-
86
-
87
-
88
-
89
-
90
-
91
-
92
-
93
-
94
-
95
-
96
-
97
-
98
-
99
-
100
-
101
-
102
-
103
-
104
-
105
-
106
-
107
-
108
-
109
-
110
-
111
-
112
-
113
-
114
-
115
-
116
-
117
-
118
-
119
-
120
-
121
-
122
-
123
-
124
-
125
-
126
-
127
-
128
-
129
-
130
-
131
-
132
-
133
-
134
-
135
-
136
-
137
-
138
-
139
-
140
-
141
-
142
-
143
-
144
-
145
-
146
-
147
-
148
-
149
-
150
-
151
-
152
-
153
-
154
-
155
-
156
-
157
-
158
-
159
-
160
-
161
-
162
-
163
-
164
-
165
-
166
-
167
-
168
-
169
-
170
-
171
-
172
-
173
-
174
-
175
-
176
-
177
-
178
-
179
-
180
-
181
-
182
-
183
-
184
-
185
-
186
-
187
-
188
-
189
-
190
-
191
-
192
-
193
-
194
-
195
 |
 |
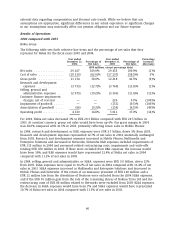
9% and 10%, respectively, of mobile device net sales, with year over year increases (measured in
euro spend) in all three mobile device business groups. Our objective is to lower the mobile device
R&D expenses/net sales ratio to 8% by the end of year 2006, while simultaneously ensuring that
the most compelling products are brought to market at the right time. We aim to achieve these
objectives by both reducing product development cycle times and also by more focused R&D
spend.
In 2004 the sales and marketing costs related to mobile devices were EUR 1.9 billion compared to
EUR 2.1 billion in 2003. We believe that in the longer term, sales and marketing costs will
increase. In the Mobile Phones business group we spent more in sales and marketing than in R&D
in 2004. However, in 2004 the Multimedia and Enterprise Solutions business groups continued to
spend more on R&D than sales and marketing. The relative importance of R&D is higher in the
Multimedia and Enterprise Solutions, while Mobile Phones business group spends proportionally
more on marketing than R&D.
Infrastructure
Our infrastructure net sales are derived from the net sales of our Networks business group, which
provides network infrastructure, communications and networks service platforms and professional
services to operators and service providers. Nokia’s Enterprise Solutions business group also
provides a variety of interoperable corporate infrastructure products, as discussed in the last
paragraph of this section. A number of factors affect the sales and profitability of our
infrastructure business, some of which are to a certain extent outside of our control, as discussed
below.
Networks net sales depend on the growth of the mobile infrastructure market, which is driven by
the level of investment by network operators. In low penetration markets, the principal factor
influencing operator investment is the growth in mobile usage and the number of subscribers.
This in turn leads to increased demand for mobile network infrastructure as operators seek to
build networks and launch commercial services to meet the coverage and capacity requirements.
In low penetration markets most new networks currently use 2G technology, and competition
among suppliers is driven by price, the ability to provide networks and services designed for low
total cost of ownership, and the ability to roll-out and support mobile networks. Investment by
network operators in low penetration markets may also depend on regulatory developments such
as the availability, number and cost of telecommunications licenses.
In more developed markets, operator investment is driven primarily by the decision to expand the
capacity of existing networks or upgrade them in order to incorporate new technologies, such as
3G. The demand for and commercial acceptance of such new technologies is largely dependent
upon the attractiveness of the related services, the availability and pricing of 3G mobile devices
and the further maturity of 3G technology. In 3G technology, suppliers compete on the basis of
price, track record of network implementations, end-to-end capabilities, and which future
technologies they plan to offer and when.
In the past, customer financing provided or arranged by suppliers to network operators in all
markets was often an important competitive requirement to bidding on or obtaining
infrastructure projects. Customer financing continues to be requested by some operators in some
markets, but to a considerably lesser extent and with considerably lower importance than during
the past years. As a strategic market requirement, we plan to continue to arrange and facilitate
financing to our customers, and provide financing and extended payment terms to a small
number of selected customers.
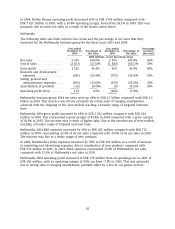
In 2002, the size of the mobile infrastructure market declined from 2001 by approximately 20%,
and a similar decline took place between 2002 and 2003. These declines reflected significantly
52