Nokia 2004 Annual Report Download - page 63
Download and view the complete annual report
Please find page 63 of the 2004 Nokia annual report below. You can navigate through the pages in the report by either clicking on the pages listed below, or by using the keyword search tool below to find specific information within the annual report.-
 1
1 -
2
-
3
-
4
-
5
-
6
-
7
-
8
-
9
-
10
-
11
-
12
-
13
-
14
-
15
-
16
-
17
-
18
-
19
-
20
-
21
-
22
-
23
-
24
-
25
-
26
-
27
-
28
-
29
-
30
-
31
-
32
-
33
-
34
-
35
-
36
-
37
-
38
-
39
-
40
-
41
-
42
-
43
-
44
-
45
-
46
-
47
-
48
-
49
-
50
-
51
-
52
-
 53
53 -
 54
54 -
 55
55 -
 56
56 -
 57
57 -
 58
58 -
 59
59 -
 60
60 -
 61
61 -
 62
62 -
 63
63 -
 64
64 -
 65
65 -
 66
66 -
 67
67 -
 68
68 -
 69
69 -
 70
70 -
 71
71 -
 72
72 -
 73
73 -
74
-
75
-
76
-
77
-
78
-
79
-
80
-
81
-
82
-
83
-
84
-
85
-
86
-
87
-
88
-
89
-
90
-
91
-
92
-
93
-
94
-
95
-
96
-
97
-
98
-
99
-
100
-
101
-
102
-
103
-
104
-
105
-
106
-
107
-
108
-
109
-
110
-
111
-
112
-
113
-
114
-
115
-
116
-
117
-
118
-
119
-
120
-
121
-
122
-
123
-
124
-
125
-
126
-
127
-
128
-
129
-
130
-
131
-
132
-
133
-
134
-
135
-
136
-
137
-
138
-
139
-
140
-
141
-
142
-
143
-
144
-
145
-
146
-
147
-
148
-
149
-
150
-
151
-
152
-
153
-
154
-
155
-
156
-
157
-
158
-
159
-
160
-
161
-
162
-
163
-
164
-
165
-
166
-
167
-
168
-
169
-
170
-
171
-
172
-
173
-
174
-
175
-
176
-
177
-
178
-
179
-
180
-
181
-
182
-
183
-
184
-
185
-
186
-
187
-
188
-
189
-
190
-
191
-
192
-
193
-
194
-
195
 |
 |

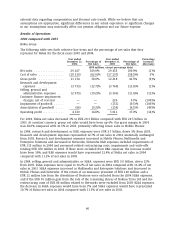
In 2004, Mobile Phones operating profit decreased 36% to EUR 3 768 million compared with
EUR 5 927 million in 2003, with a 20.4% operating margin, down from 28.3% in 2003. This was
primarily due to lower net sales as a result of the factors noted above.
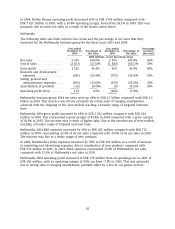
Multimedia
The following table sets forth selective line items and the percentage of net sales that they
represent for the Multimedia business group for the fiscal years 2003 and 2004.
Year ended Year ended Percentage
December 31, Percentage of December 31, Percentage of Increase/
2004 Net Sales 2003 Net Sales (decrease)
(EUR millions, except percentage data)
Net sales .................. 3 659 100.0% 2 504 100.0% 46%
Cost of sales ................ (2 107) (57.6)% (1 580) (63.1)% 33%
Gross profit ................ 1 552 42.4% 924 36.9% 68%
Research and development
expenses ................. (855) (23.4)% (725) (29.0)% 18%
Selling, general and
administrative expenses .... (506) (13.8)% (376) (15.0)% 35%
Amortization of goodwill ..... (12) (0.3)% (9) (0.3)% 33%
Operating profit (loss) ........ 179 4.9% (186) (7.4)%
Multimedia business group 2004 net sales were up 46% to EUR 3.7 billion compared with EUR 2.5
billion in 2003. This increase was driven primarily by robust sales of imaging smartphones,
achieved with the shipping of five new models reaching a broader range of targeted customer
base.
Multimedia 2004 gross profit increased by 68% to EUR 1 552 million compared with EUR 924
million in 2003. This represented a gross margin of 42.4% in 2004 compared with a gross margin
of 36.9% in 2003. The increase was a result of higher sales, due to the introduction of new models
reaching a broader range of targeted customer base.
Multimedia 2004 R&D expenses increased by 18% to EUR 855 million compared with EUR 725
million in 2003, representing 23.4% of its net sales compared with 29.0% of its net sales in 2003.
The increase was due to a wider range of new products.
In 2004, Multimedia’s SG&A expenses increased by 35% to EUR 506 million as a result of increase
in marketing and advertising expenses, due to introduction of new products compared with
EUR 376 million in 2003. In 2004, SG&A expenses represented 13.8% of Multimedia’s net sales
compared with 15.0% of Multimedia’s net sales in 2003.
Multimedia 2004 operating profit increased to EUR 179 million from an operating loss in 2003 of
EUR 186 million, with an operating margin of 4.9%, up from -7.4% in 2003. This was primarily
due to strong sales of imaging smartphones, partially offset by a loss in our games devices.
62