Nokia 2004 Annual Report Download - page 164
Download and view the complete annual report
Please find page 164 of the 2004 Nokia annual report below. You can navigate through the pages in the report by either clicking on the pages listed below, or by using the keyword search tool below to find specific information within the annual report.-
 1
1 -
2
-
3
-
4
-
5
-
6
-
7
-
8
-
9
-
10
-
11
-
12
-
13
-
14
-
15
-
16
-
17
-
18
-
19
-
20
-
21
-
22
-
23
-
24
-
25
-
26
-
27
-
28
-
29
-
30
-
31
-
32
-
33
-
34
-
35
-
36
-
37
-
38
-
39
-
40
-
41
-
42
-
43
-
44
-
45
-
46
-
47
-
48
-
49
-
50
-
51
-
52
-
53
-
54
-
55
-
56
-
57
-
58
-
59
-
60
-
61
-
62
-
63
-
64
-
65
-
66
-
67
-
68
-
69
-
70
-
71
-
72
-
73
-
74
-
75
-
76
-
77
-
78
-
79
-
80
-
81
-
82
-
83
-
84
-
85
-
86
-
87
-
88
-
89
-
90
-
91
-
92
-
93
-
94
-
95
-
96
-
97
-
98
-
99
-
100
-
101
-
102
-
103
-
104
-
105
-
106
-
107
-
108
-
109
-
110
-
111
-
112
-
113
-
114
-
115
-
116
-
117
-
118
-
119
-
120
-
121
-
122
-
123
-
124
-
125
-
126
-
127
-
128
-
129
-
130
-
131
-
132
-
133
-
134
-
135
-
136
-
137
-
138
-
139
-
140
-
141
-
142
-
143
-
144
-
145
-
146
-
147
-
148
-
149
-
150
-
151
-
152
-
153
-
 154
154 -
 155
155 -
 156
156 -
 157
157 -
 158
158 -
 159
159 -
 160
160 -
 161
161 -
 162
162 -
 163
163 -
 164
164 -
 165
165 -
 166
166 -
 167
167 -
 168
168 -
 169
169 -
 170
170 -
 171
171 -
 172
172 -
 173
173 -
 174
174 -
175
-
176
-
177
-
178
-
179
-
180
-
181
-
182
-
183
-
184
-
185
-
186
-
187
-
188
-
189
-
190
-
191
-
192
-
193
-
194
-
195
 |
 |

Notes to the Consolidated Financial Statements (Continued)
22. The shares of the Parent Company (Continued)
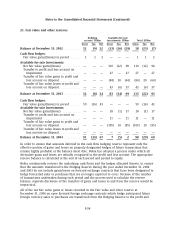
Information relating to stock options during 2004, 2003 and 2002 are as follows:
Number of Weighted average
shares exercise price
EUR
Shares under option at December 31, 2001 ................. 227,999,753 25.71
Granted(1) .............................................. 51,127,314 17.96
Exercised .............................................. 51,586,807 3.61
Forfeited .............................................. 6,097,025 33.51
Shares under option at December 31, 2002 ................. 221,443,235 28.81
Granted(1) .............................................. 31,098,505 14.94
Exercised .............................................. 7,700,791 3.97
Forfeited .............................................. 5,847,332 25.23
Shares under option at December 31, 2003 ................. 238,993,617 27.90
Granted ............................................... 7,172,424 11.88
Exercised .............................................. 781,338 12.85
Forfeited .............................................. 4,733,995 19.55
Expired ............................................... 97,693,392 33.99
Shares under option at December 31, 2004 ................. 142,957,316 23.29
Options exercisable at December 31, 2002 (shares) ............. 107,721,842 27.92
Options exercisable at December 31, 2003 (shares) ............. 148,150,370 31.88
Options exercisable at December 31, 2004 (shares) ........... 83,667,122 26.18
(1) Includes options converted in acquisitions.
The options outstanding by range of exercise price at December 31, 2004 are as follows:
Options outstanding Vested options outstanding
Weighted average
remaining
contractual life in Weighted average Weighted average
Exercise prices Number of shares years exercise price Number of shares exercise price
EUR EUR EUR
0.28–14.72 8,566,058 3.50 11.26 1,524,533 8.72
14.95 28,912,535 2.30 14.95 9,027,050 14.95
14.97–17.29 323,635 2.40 15.70 98,242 16.58
17.89 46,657,996 1.57 17.89 26,387,016 17.89
18.18–26.67 19,171,279 1.46 27.61 14,181,913 26.49
28.87–36.15 139,708 5.08 33.87 139,613 33.87
36.75 38,980,544 1.46 36.75 32,103,194 36.75
38.09–56.28 205,561 3.95 39.54 205,561 39.54
142,957,316 83,667,122
F-39