Nokia 2004 Annual Report Download - page 74
Download and view the complete annual report
Please find page 74 of the 2004 Nokia annual report below. You can navigate through the pages in the report by either clicking on the pages listed below, or by using the keyword search tool below to find specific information within the annual report.-
 1
1 -
2
-
3
-
4
-
5
-
6
-
7
-
8
-
9
-
10
-
11
-
12
-
13
-
14
-
15
-
16
-
17
-
18
-
19
-
20
-
21
-
22
-
23
-
24
-
25
-
26
-
27
-
28
-
29
-
30
-
31
-
32
-
33
-
34
-
35
-
36
-
37
-
38
-
39
-
40
-
41
-
42
-
43
-
44
-
45
-
46
-
47
-
48
-
49
-
50
-
51
-
52
-
53
-
54
-
55
-
56
-
57
-
58
-
59
-
60
-
61
-
62
-
63
-
 64
64 -
 65
65 -
 66
66 -
 67
67 -
 68
68 -
 69
69 -
 70
70 -
 71
71 -
 72
72 -
 73
73 -
 74
74 -
 75
75 -
 76
76 -
 77
77 -
 78
78 -
 79
79 -
 80
80 -
 81
81 -
 82
82 -
 83
83 -
 84
84 -
85
-
86
-
87
-
88
-
89
-
90
-
91
-
92
-
93
-
94
-
95
-
96
-
97
-
98
-
99
-
100
-
101
-
102
-
103
-
104
-
105
-
106
-
107
-
108
-
109
-
110
-
111
-
112
-
113
-
114
-
115
-
116
-
117
-
118
-
119
-
120
-
121
-
122
-
123
-
124
-
125
-
126
-
127
-
128
-
129
-
130
-
131
-
132
-
133
-
134
-
135
-
136
-
137
-
138
-
139
-
140
-
141
-
142
-
143
-
144
-
145
-
146
-
147
-
148
-
149
-
150
-
151
-
152
-
153
-
154
-
155
-
156
-
157
-
158
-
159
-
160
-
161
-
162
-
163
-
164
-
165
-
166
-
167
-
168
-
169
-
170
-
171
-
172
-
173
-
174
-
175
-
176
-
177
-
178
-
179
-
180
-
181
-
182
-
183
-
184
-
185
-
186
-
187
-
188
-
189
-
190
-
191
-
192
-
193
-
194
-
195
 |
 |
EUR 10 805 million at the end of 2003. In addition we hold EUR 255 million, compared with
EUR 816 million in 2003, of subordinated convertible perpetual bonds of France Telecom classified
as available-for-sale investments and not included in cash and other liquid assets. We were not
unconditionally permitted to sell these bonds until the end of June 2004. For further information
regarding our long-term liabilities, including interest rate structure and currency mix, see Note 23
to our consolidated financial statements included in Item 18 of this Form 20-F. Our ratio of net
interest-bearing debt, defined as short-term and long-term debt less cash and other liquid assets,
to equity, defined as shareholders’ equity and minority interests, was –78%, –71% and –61% at
December 31, 2004, 2003 and 2002, respectively. The change in 2004 resulted from both our
continued good profitability and the improvements in our cash and other liquid assets position.
The total dividends per share were EUR 0.33 for the year ended December 31, 2004, subject to
shareholders’ approval, compared with EUR 0.30 and EUR 0.28 for the years ended December 31,
2003 and 2002, respectively. See ‘‘Item 3.A Selected Financial Data—Distribution of Earnings.’’
Nokia has no potentially significant refinancing requirements in 2005. Nokia expects to incur
additional indebtedness from time to time as required to finance working capital needs. At
December 31, 2004, Nokia had a USD 500 million US Commercial Paper, or USCP, program and a
USD 500 million Euro Commercial Paper, or ECP, program. In addition, at the same date, Nokia had
a Finnish local commercial paper program totaling EUR 750 million. At December 31, 2004, we also
had a committed credit facility of USD 2 000 million and a number of short-term uncommitted
facilities. For further information regarding our short-term borrowings, including the average
interest rate, see Note 26 to our consolidated financial statements included in Item 18 of this
Form 20-F.
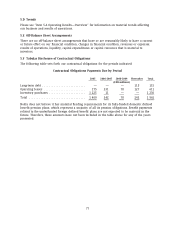
Nokia has historically maintained a high level of liquid assets. Management estimates that the cash
and other liquid assets level of EUR 11 542 million at the end of 2004, together with Nokia’s
available credit facilities, cash flow from operations, funds available from long-term and
short-term debt financings, as well as the proceeds of future equity or convertible bond offerings,
will be sufficient to satisfy our future working capital needs, capital expenditure, research and
development and debt service requirements at least through 2005. The ratings of our short and
long-term debt from credit rating agencies have not changed during the year. The ratings at
December 31, 2004, were:
Short-term Standard & Poor’s A-1
Moody’s P-1
Long-term Standard & Poor’s A
Moody’s A1
We believe that Nokia will continue to be able to access the capital markets on terms and in
amounts that will be satisfactory to us, and that we will be able to obtain bid and performance
bonds, to arrange or provide customer financing as necessary to support our business and to
engage in hedging transactions on commercially acceptable terms.
Nokia is not a capital intensive company in terms of fixed assets, but rather invests in research
and development, building the Nokia brand and marketing. In 2004, capital expenditures totaled
EUR 548 million compared with EUR 432 million in each of 2003 and 2002. The increase in 2004
resulted from increased amount of capital expenditures in machinery and equipment. Principal
capital expenditures during the three years included production lines, test equipment and
computer hardware used primarily in research and development as well as office and
manufacturing facilities. We expect the amount of our capital expenditures during 2005 to be
somewhat higher than 2004 and to be funded from our cash flow from operations.
73