Nokia 2004 Annual Report Download - page 49
Download and view the complete annual report
Please find page 49 of the 2004 Nokia annual report below. You can navigate through the pages in the report by either clicking on the pages listed below, or by using the keyword search tool below to find specific information within the annual report.-
 1
1 -
2
-
3
-
4
-
5
-
6
-
7
-
8
-
9
-
10
-
11
-
12
-
13
-
14
-
15
-
16
-
17
-
18
-
19
-
20
-
21
-
22
-
23
-
24
-
25
-
26
-
27
-
28
-
29
-
30
-
31
-
32
-
33
-
34
-
35
-
36
-
37
-
38
-
 39
39 -
 40
40 -
 41
41 -
 42
42 -
 43
43 -
 44
44 -
 45
45 -
 46
46 -
 47
47 -
 48
48 -
 49
49 -
 50
50 -
 51
51 -
 52
52 -
 53
53 -
 54
54 -
 55
55 -
 56
56 -
 57
57 -
 58
58 -
 59
59 -
60
-
61
-
62
-
63
-
64
-
65
-
66
-
67
-
68
-
69
-
70
-
71
-
72
-
73
-
74
-
75
-
76
-
77
-
78
-
79
-
80
-
81
-
82
-
83
-
84
-
85
-
86
-
87
-
88
-
89
-
90
-
91
-
92
-
93
-
94
-
95
-
96
-
97
-
98
-
99
-
100
-
101
-
102
-
103
-
104
-
105
-
106
-
107
-
108
-
109
-
110
-
111
-
112
-
113
-
114
-
115
-
116
-
117
-
118
-
119
-
120
-
121
-
122
-
123
-
124
-
125
-
126
-
127
-
128
-
129
-
130
-
131
-
132
-
133
-
134
-
135
-
136
-
137
-
138
-
139
-
140
-
141
-
142
-
143
-
144
-
145
-
146
-
147
-
148
-
149
-
150
-
151
-
152
-
153
-
154
-
155
-
156
-
157
-
158
-
159
-
160
-
161
-
162
-
163
-
164
-
165
-
166
-
167
-
168
-
169
-
170
-
171
-
172
-
173
-
174
-
175
-
176
-
177
-
178
-
179
-
180
-
181
-
182
-
183
-
184
-
185
-
186
-
187
-
188
-
189
-
190
-
191
-
192
-
193
-
194
-
195
 |
 |

Principal Factors Affecting our Results of Operations
Mobile Devices
Our mobile device sales are derived from the sale of mobile devices by our Mobile Phones and
Multimedia business groups and by the Mobile Devices business unit of our Enterprise Solutions
business group. Our principal customers are mobile network operators, distributors, independent
retailers and enterprise customers. Our product portfolio covers all major user segments and price
points from entry-level to mid-range and high-end devices offering voice, data, imaging, games,
multimedia and business applications. A number of factors affect our sales and profitability, some
of which are to a certain extent outside of our control.
Our sales depend on the global growth in mobile device volumes driven by growth in both the
number of existing mobile subscribers who upgrade or simply replace their existing mobile
devices as well as in the number of new subscribers. Industry volume growth is influenced by,
among other factors, regional economic factors, competitive pressures, regulatory environment, the
timing and success of product and service introductions by various market participants, including
network operators, the commercial acceptance of new mobile devices, technologies and services,
and operators’ and distributors’ financial situations. Industry volumes are also affected by the level
of mobile device subsidies that network operators are willing to offer to end users. In highly
penetrated markets, industry volumes are dependent on the ability of network operators to
successfully introduce services that drive the upgrade and replacement of devices. In low
penetration markets, the availability and cost, through affordable tariffs, of mobile phone service
compared with the availability and cost of fixed line networks also impact volume growth.
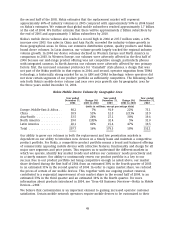
According to Nokia’s estimates, in 2004 the global device market volume grew by 31% to
643 million units compared with 490 million units in 2003, a record for the industry. This growth
was driven by the ongoing boom in new subscriber growth in Latin America, Russia, India and
China and robust replacement sales of color screen and camera phones in Western Europe and
North America. The following chart sets forth the global mobile device market volume and year
over year growth rate by geographic area for the three years ended December 31, 2004 based on
Nokia’s estimates.
Global Mobile Device Market Volume by Geographic Area
based on Nokia’s Estimates
Year ended Year ended Year ended
December 31, Change (%) December 31, Change (%) December 31,
2004 2003 to 2004 2003 2002 to 2003 2002
(units in millions, except percentage data)
Europe, Middle-East & Africa . . 240 33% 181 29% 140
China .................... 83 32% 63 3% 61
Asia-Pacific ............... 124 15% 108 23% 88
North America ............. 124 22% 102 15% 89
Latin America ............. 72 100% 36 33% 27
Total .................... 643 31% 490 21% 405
Nokia expects the overall mobile device market in 2005 to grow by approximately 10% in volume,
compared with 2004, but to grow less in value. Growth is expected to continue to be driven by
ongoing replacement sales in more developed markets and new subscribers in low penetration
mobile markets such as India, Russia, China, most Latin American countries and several Middle
Eastern and African countries. We believe that replacement sales will be driven by the availability
of larger and brighter color screens and cameras, as well as the commercialization of 3G devices in
48