Nokia 2004 Annual Report Download - page 156
Download and view the complete annual report
Please find page 156 of the 2004 Nokia annual report below. You can navigate through the pages in the report by either clicking on the pages listed below, or by using the keyword search tool below to find specific information within the annual report.-
 1
1 -
2
-
3
-
4
-
5
-
6
-
7
-
8
-
9
-
10
-
11
-
12
-
13
-
14
-
15
-
16
-
17
-
18
-
19
-
20
-
21
-
22
-
23
-
24
-
25
-
26
-
27
-
28
-
29
-
30
-
31
-
32
-
33
-
34
-
35
-
36
-
37
-
38
-
39
-
40
-
41
-
42
-
43
-
44
-
45
-
46
-
47
-
48
-
49
-
50
-
51
-
52
-
53
-
54
-
55
-
56
-
57
-
58
-
59
-
60
-
61
-
62
-
63
-
64
-
65
-
66
-
67
-
68
-
69
-
70
-
71
-
72
-
73
-
74
-
75
-
76
-
77
-
78
-
79
-
80
-
81
-
82
-
83
-
84
-
85
-
86
-
87
-
88
-
89
-
90
-
91
-
92
-
93
-
94
-
95
-
96
-
97
-
98
-
99
-
100
-
101
-
102
-
103
-
104
-
105
-
106
-
107
-
108
-
109
-
110
-
111
-
112
-
113
-
114
-
115
-
116
-
117
-
118
-
119
-
120
-
121
-
122
-
123
-
124
-
125
-
126
-
127
-
128
-
129
-
130
-
131
-
132
-
133
-
134
-
135
-
136
-
137
-
138
-
139
-
140
-
141
-
142
-
143
-
144
-
145
-
 146
146 -
 147
147 -
 148
148 -
 149
149 -
 150
150 -
 151
151 -
 152
152 -
 153
153 -
 154
154 -
 155
155 -
 156
156 -
 157
157 -
 158
158 -
 159
159 -
 160
160 -
 161
161 -
 162
162 -
 163
163 -
 164
164 -
 165
165 -
 166
166 -
167
-
168
-
169
-
170
-
171
-
172
-
173
-
174
-
175
-
176
-
177
-
178
-
179
-
180
-
181
-
182
-
183
-
184
-
185
-
186
-
187
-
188
-
189
-
190
-
191
-
192
-
193
-
194
-
195
 |
 |

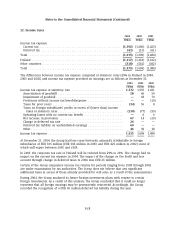
Notes to the Consolidated Financial Statements (Continued)
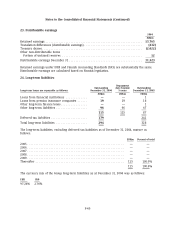
15. Investments in associated companies
2004 2003
EURm EURm
Net carrying amount January 1 ........................................... 76 49
Additions ............................................................ 150 59
Share of results ....................................................... (26) (18)
Translation differences .................................................. 1(2)
Other movements ...................................................... (1) (12)
Net carrying amount December 31 ........................................ 200 76
In 2004, Nokia increased its ownership in Symbian from 32.2% to 47.9% by acquiring part of the
shares of Symbian owned by Psion for EUR 102 million (GBP 70 million). EUR 68 million
(GBP 47 million) of the total acquisition cost was paid in cash and the remaining purchase price is
considered as contingent consideration to be paid in 2005 and 2006. Nokia also participated in a
rights issue to raise EUR 73 million (GBP 50 million) additional funding to Symbian. The issue was
pro rata to existing shareholders.
In 2003, Nokia increased its ownership in Symbian from 19.0% to 32.2% by acquiring part of the
shares of Symbian owned by Motorola representing 13.2% of all the shares in Symbian, for EUR 57
million (GBP 39.6 million) in cash.
Shareholdings in associated companies are comprised of investments in unlisted companies in all
periods presented.
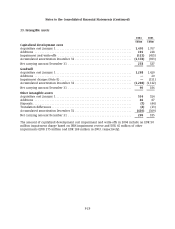
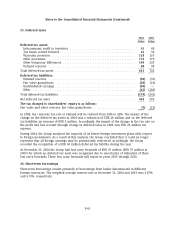
16. Available-for-sale investments
2004 2003
As restated
EURm EURm
Fair value at January 1 ............................................ 11,088 8,093
Additions (deductions), net ......................................... (221) 2,911
Fair value gains/losses ............................................. 20 111
Impairment charges (Note 8) ........................................ (11) (27)
Fair value at December 31 .......................................... 10,876 11,088
Non-current ..................................................... 169 121
Current ......................................................... 255 816
Current, liquid assets .............................................. 9,085 8,512*
Current, cash equivalents .......................................... 1,367 1,639*
(*) See Note 2
Available-for-sale investments, comprising marketable debt and equity securities and investments
in unlisted equity shares, are fair valued, except in the case of certain unlisted equities, where the
fair value cannot be measured reliably. Such unlisted equities are carried at cost, less impairment
(EUR 54 million in 2004 and EUR 45 million in 2003). Fair value for equity investments traded in
active markets and for unlisted equities, where the fair value can be measured reliably, was
EUR 115 million in 2004 and EUR 77 million in 2003. Fair value for equity investments traded in
F-31