Nokia 2004 Annual Report Download - page 66
Download and view the complete annual report
Please find page 66 of the 2004 Nokia annual report below. You can navigate through the pages in the report by either clicking on the pages listed below, or by using the keyword search tool below to find specific information within the annual report.-
 1
1 -
2
-
3
-
4
-
5
-
6
-
7
-
8
-
9
-
10
-
11
-
12
-
13
-
14
-
15
-
16
-
17
-
18
-
19
-
20
-
21
-
22
-
23
-
24
-
25
-
26
-
27
-
28
-
29
-
30
-
31
-
32
-
33
-
34
-
35
-
36
-
37
-
38
-
39
-
40
-
41
-
42
-
43
-
44
-
45
-
46
-
47
-
48
-
49
-
50
-
51
-
52
-
53
-
54
-
55
-
 56
56 -
 57
57 -
 58
58 -
 59
59 -
 60
60 -
 61
61 -
 62
62 -
 63
63 -
 64
64 -
 65
65 -
 66
66 -
 67
67 -
 68
68 -
 69
69 -
 70
70 -
 71
71 -
 72
72 -
 73
73 -
 74
74 -
 75
75 -
 76
76 -
77
-
78
-
79
-
80
-
81
-
82
-
83
-
84
-
85
-
86
-
87
-
88
-
89
-
90
-
91
-
92
-
93
-
94
-
95
-
96
-
97
-
98
-
99
-
100
-
101
-
102
-
103
-
104
-
105
-
106
-
107
-
108
-
109
-
110
-
111
-
112
-
113
-
114
-
115
-
116
-
117
-
118
-
119
-
120
-
121
-
122
-
123
-
124
-
125
-
126
-
127
-
128
-
129
-
130
-
131
-
132
-
133
-
134
-
135
-
136
-
137
-
138
-
139
-
140
-
141
-
142
-
143
-
144
-
145
-
146
-
147
-
148
-
149
-
150
-
151
-
152
-
153
-
154
-
155
-
156
-
157
-
158
-
159
-
160
-
161
-
162
-
163
-
164
-
165
-
166
-
167
-
168
-
169
-
170
-
171
-
172
-
173
-
174
-
175
-
176
-
177
-
178
-
179
-
180
-
181
-
182
-
183
-
184
-
185
-
186
-
187
-
188
-
189
-
190
-
191
-
192
-
193
-
194
-
195
 |
 |
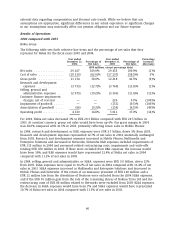
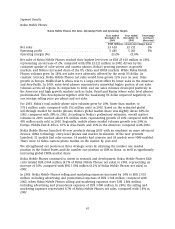
profitability of 3G contracts, and a streamlined cost structure as a result of restructuring actions
taken in 2003.
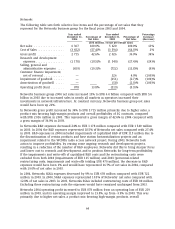
Networks 2004 operating profit included impairments of capitalized R&D costs of EUR 115 million.
In 2003 Networks operating profit included a positive adjustment of EUR 226 million as a result of
the customer finance impairment recorded in 2002 related to Mobilcom, and R&D related costs
totaling EUR 470 million, other restructuring costs of EUR 80 million, as well as a goodwill
impairment of EUR 151 million related to Nokia Networks’ core networks business, with a total
net impact of EUR 475 million.
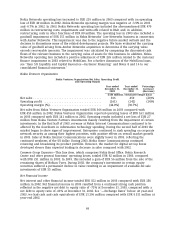
Common Group Expenses
Common Group expenses totaled to EUR 296 million in 2004 compared with EUR 370 million in
2003. In 2004, this included a positive item of EUR 160 million representing the premium return
under our multi-line, multi-year insurance program, which expired during 2004. The return was
due to our low claims experience during the policy period. It also included a EUR 12 million
negative impact from the divestiture of Nextrom. In 2003, Common Group expenses included the
gain of EUR 56 million on the sale of the remaining shares of Nokian Tyres Ltd.
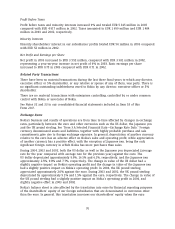
Net Financial Income
Net financial income totaled to EUR 405 million in 2004 compared with EUR 352 million in 2003.
Net financial income in 2004 resulted from a continued strong cash position reflected in the
negative net debt to equity ratio of -78% at December 31, 2004 compared with a net debt to
equity ratio of -71% at December 31, 2003. See ‘‘—Exchange Rates’’ below. During 2004, Nokia sold
approximately 69% of the original holdings in its subordinated convertible perpetual bonds issued
by France Telecom. As a result, the company booked a total net gain of EUR 106 million. The
bonds had been classified as available-for-sale investments and fair valued through shareholders’
equity.
Profit Before Taxes
Profit before tax and minority interests decreased 12% to EUR 4 709 million in 2004 compared
with EUR 5 345 million in 2003. Taxes amounted to EUR 1 435 million and EUR 1 699 million in
2004 and 2003, respectively. Effective tax rate changed slightly to 30.5% in 2004 compared with
31.8% in 2003. Excluding the impact of non-deductible goodwill impairments the tax rate in 2003
would have been 30.9%.
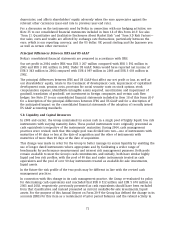
Minority Interests
Minority shareholders’ interest in our subsidiaries’ profits totaled EUR 67 million in 2004 compared
with EUR 54 million in 2003.
Net Profit and Earnings per Share
Net profit in 2004 totaled to EUR 3 207 million compared with EUR 3 592 million in 2003,
representing a year-on-year decrease in net profit of 11% in 2004. Earnings per share in 2004
decreased to EUR 0.70 (basic and diluted), compared with EUR 0.75 (basic and diluted) in 2003.
65