Nokia 2004 Annual Report Download - page 145
Download and view the complete annual report
Please find page 145 of the 2004 Nokia annual report below. You can navigate through the pages in the report by either clicking on the pages listed below, or by using the keyword search tool below to find specific information within the annual report.-
 1
1 -
2
-
3
-
4
-
5
-
6
-
7
-
8
-
9
-
10
-
11
-
12
-
13
-
14
-
15
-
16
-
17
-
18
-
19
-
20
-
21
-
22
-
23
-
24
-
25
-
26
-
27
-
28
-
29
-
30
-
31
-
32
-
33
-
34
-
35
-
36
-
37
-
38
-
39
-
40
-
41
-
42
-
43
-
44
-
45
-
46
-
47
-
48
-
49
-
50
-
51
-
52
-
53
-
54
-
55
-
56
-
57
-
58
-
59
-
60
-
61
-
62
-
63
-
64
-
65
-
66
-
67
-
68
-
69
-
70
-
71
-
72
-
73
-
74
-
75
-
76
-
77
-
78
-
79
-
80
-
81
-
82
-
83
-
84
-
85
-
86
-
87
-
88
-
89
-
90
-
91
-
92
-
93
-
94
-
95
-
96
-
97
-
98
-
99
-
100
-
101
-
102
-
103
-
104
-
105
-
106
-
107
-
108
-
109
-
110
-
111
-
112
-
113
-
114
-
115
-
116
-
117
-
118
-
119
-
120
-
121
-
122
-
123
-
124
-
125
-
126
-
127
-
128
-
129
-
130
-
131
-
132
-
133
-
134
-
 135
135 -
 136
136 -
 137
137 -
 138
138 -
 139
139 -
 140
140 -
 141
141 -
 142
142 -
 143
143 -
 144
144 -
 145
145 -
 146
146 -
 147
147 -
 148
148 -
 149
149 -
 150
150 -
 151
151 -
 152
152 -
 153
153 -
 154
154 -
 155
155 -
156
-
157
-
158
-
159
-
160
-
161
-
162
-
163
-
164
-
165
-
166
-
167
-
168
-
169
-
170
-
171
-
172
-
173
-
174
-
175
-
176
-
177
-
178
-
179
-
180
-
181
-
182
-
183
-
184
-
185
-
186
-
187
-
188
-
189
-
190
-
191
-
192
-
193
-
194
-
195
 |
 |

Notes to the Consolidated Financial Statements (Continued)
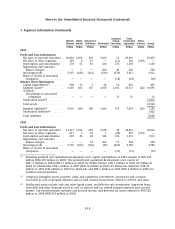
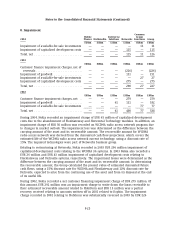
3. Segment information (Continued)
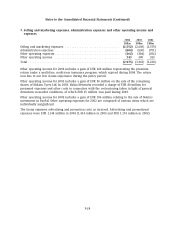
(4) Comprises accounts payable, prepaid income, accrued expenses and provisions except those related to
interest and taxes.
(5) Unallocated liabilities include long-term liabilities, short-term borrowings and current portion of
long-term debt, as well as interest and tax related prepaid income, accrued expenses and provisions. Tax
related prepaid income and accrued expenses, and deferred tax liabilities amount to EUR 246 million in
2004 (EUR 394 million in 2003).
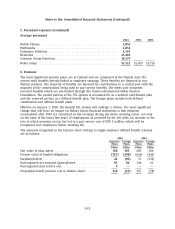
2004 2003 2002
EURm EURm EURm
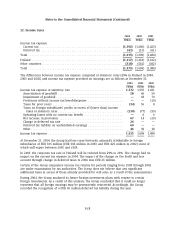
Net sales to external customers by geographic area
by location of customer
Finland ...................................................... 351 347 353
USA......................................................... 3,416 4,475 4,665
China ........................................................ 2,660 2,013 2,802
Great Britain .................................................. 2,261 2,693 3,111
Germany ..................................................... 1,730 2,297 1,849
Other ........................................................ 18,849 17,630 17,236
Total ........................................................ 29,267 29,455 30,016
2004 2003
EURm EURm
Segment assets by geographic area
Finland ...................................................... 3,429 4,215
USA......................................................... 1,025 1,563
China ........................................................ 880 1,011
Great Britain .................................................. 502 344
Germany ..................................................... 353 387
Other ........................................................ 2,751 2,575
Total ........................................................ 8,940 10,095
2004 2003 2002
EURm EURm EURm
Capital expenditures by market area
Finland ...................................................... 216 160 188
USA......................................................... 80 49 71
China ........................................................ 57 53 47
Great Britain .................................................. 5927
Germany ..................................................... 20 17 21
Other ........................................................ 170 144 78
Total(1) ....................................................... 548 432 432
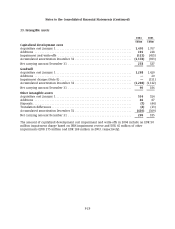
(1) Including goodwill and capitalized development costs, capital expenditures amount to EUR 649
million in 2004 (EUR 670 million in 2003 and EUR 860 million in 2002). The goodwill and
capitalized development costs in 2004 consist of EUR 0 million in USA (EUR 20 million in USA in
2003 and 1 million in USA in 2002) and EUR 101 million in other areas (EUR 218 million in 2003
and EUR 427 million in 2002).
F-20