Nokia 2004 Annual Report Download - page 143
Download and view the complete annual report
Please find page 143 of the 2004 Nokia annual report below. You can navigate through the pages in the report by either clicking on the pages listed below, or by using the keyword search tool below to find specific information within the annual report.-
 1
1 -
2
-
3
-
4
-
5
-
6
-
7
-
8
-
9
-
10
-
11
-
12
-
13
-
14
-
15
-
16
-
17
-
18
-
19
-
20
-
21
-
22
-
23
-
24
-
25
-
26
-
27
-
28
-
29
-
30
-
31
-
32
-
33
-
34
-
35
-
36
-
37
-
38
-
39
-
40
-
41
-
42
-
43
-
44
-
45
-
46
-
47
-
48
-
49
-
50
-
51
-
52
-
53
-
54
-
55
-
56
-
57
-
58
-
59
-
60
-
61
-
62
-
63
-
64
-
65
-
66
-
67
-
68
-
69
-
70
-
71
-
72
-
73
-
74
-
75
-
76
-
77
-
78
-
79
-
80
-
81
-
82
-
83
-
84
-
85
-
86
-
87
-
88
-
89
-
90
-
91
-
92
-
93
-
94
-
95
-
96
-
97
-
98
-
99
-
100
-
101
-
102
-
103
-
104
-
105
-
106
-
107
-
108
-
109
-
110
-
111
-
112
-
113
-
114
-
115
-
116
-
117
-
118
-
119
-
120
-
121
-
122
-
123
-
124
-
125
-
126
-
127
-
128
-
129
-
130
-
131
-
132
-
 133
133 -
 134
134 -
 135
135 -
 136
136 -
 137
137 -
 138
138 -
 139
139 -
 140
140 -
 141
141 -
 142
142 -
 143
143 -
 144
144 -
 145
145 -
 146
146 -
 147
147 -
 148
148 -
 149
149 -
 150
150 -
 151
151 -
 152
152 -
 153
153 -
154
-
155
-
156
-
157
-
158
-
159
-
160
-
161
-
162
-
163
-
164
-
165
-
166
-
167
-
168
-
169
-
170
-
171
-
172
-
173
-
174
-
175
-
176
-
177
-
178
-
179
-
180
-
181
-
182
-
183
-
184
-
185
-
186
-
187
-
188
-
189
-
190
-
191
-
192
-
193
-
194
-
195
 |
 |

Notes to the Consolidated Financial Statements (Continued)
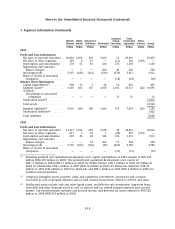
3. Segment information (Continued)
Enterprise Solutions offers businesses solutions ranging from business-optimized mobile devices
for end users to a broad portfolio of IP network perimeter security gateways and mobile
connectivity offerings.
Networks is a leading provider of network infrastructure, communications and networks service
platforms and professional services to operators and service providers.
In addition to the four business groups, the Group’s organization has two horizontal units to
support the mobile device business groups, increase operational efficiency and competitiveness,
and to take advantage of economies of scale: Customer and Market Operations and Technology
Platforms. The horizontal groups are not separate reporting entities, but their costs are carried
mainly by the mobile device business groups, which comprises of Mobile Phones, Multimedia and
Enterprise Solutions, with the balance included in Common Group Expenses. The costs and
revenues as well as assets and liabilities of the horizontal groups are allocated to the mobile
device business groups on a symmetrical basis; with any amounts not so allocated included in
Common Group Functions. Common Group Functions consists of common research and general
Group functions.
The accounting policies of the segments are the same as those described in Note 1. Nokia accounts
for intersegment revenues and transfers as if the revenues or transfers were to third parties, that
is, at current market prices. Nokia evaluates the performance of its segments and allocates
resources to them based on operating profit.
No single customer represents 10% or more of Group revenues.
Common Total
Mobile Multi- Enterprise Group reportable Elimi-
Phones media Solutions Networks Functions segments nations Group
EURm EURm EURm EURm EURm EURm EURm EURm
2004
Profit and Loss Information
Net sales to external customers . . 18,429 3,636 806 6,367 29 29,267 29,267
Net sales to other segments ..... 78 23 24 — (29) 96 (96) —
Depreciation and amortization . . 306 77 23 314 148 868 868
Impairment and customer
finance charges ............ — — — 115 11 126 126
Operating profit ............. 3,768 179 (199) 878 (296) 4,330 4,330
Share of results of associated
companies ................ — — — — (26) (26) (26)
Balance Sheet Information
Capital expenditures(1) ......... 279 67 18 91 93 548 548
Segment assets(2) ............. 3,758 787 210 3,055 1,142 8,952 (12) 8,940
of which:
Investments in associated
companies .............. — — — — 200 200 200
Unallocated assets(3) .......... 13,729
Total assets ................. 22,669
Segment liabilities(4) .......... 4,114 934 271 1,574 170 7,063 (12) 7,051
Unallocated liabilities(5) ........ 1,212
Total liabilities .............. 8,263
F-18