Nokia 2004 Annual Report Download - page 187
Download and view the complete annual report
Please find page 187 of the 2004 Nokia annual report below. You can navigate through the pages in the report by either clicking on the pages listed below, or by using the keyword search tool below to find specific information within the annual report.-
 1
1 -
2
-
3
-
4
-
5
-
6
-
7
-
8
-
9
-
10
-
11
-
12
-
13
-
14
-
15
-
16
-
17
-
18
-
19
-
20
-
21
-
22
-
23
-
24
-
25
-
26
-
27
-
28
-
29
-
30
-
31
-
32
-
33
-
34
-
35
-
36
-
37
-
38
-
39
-
40
-
41
-
42
-
43
-
44
-
45
-
46
-
47
-
48
-
49
-
50
-
51
-
52
-
53
-
54
-
55
-
56
-
57
-
58
-
59
-
60
-
61
-
62
-
63
-
64
-
65
-
66
-
67
-
68
-
69
-
70
-
71
-
72
-
73
-
74
-
75
-
76
-
77
-
78
-
79
-
80
-
81
-
82
-
83
-
84
-
85
-
86
-
87
-
88
-
89
-
90
-
91
-
92
-
93
-
94
-
95
-
96
-
97
-
98
-
99
-
100
-
101
-
102
-
103
-
104
-
105
-
106
-
107
-
108
-
109
-
110
-
111
-
112
-
113
-
114
-
115
-
116
-
117
-
118
-
119
-
120
-
121
-
122
-
123
-
124
-
125
-
126
-
127
-
128
-
129
-
130
-
131
-
132
-
133
-
134
-
135
-
136
-
137
-
138
-
139
-
140
-
141
-
142
-
143
-
144
-
145
-
146
-
147
-
148
-
149
-
150
-
151
-
152
-
153
-
154
-
155
-
156
-
157
-
158
-
159
-
160
-
161
-
162
-
163
-
164
-
165
-
166
-
167
-
168
-
169
-
170
-
171
-
172
-
173
-
174
-
175
-
176
-
 177
177 -
 178
178 -
 179
179 -
 180
180 -
 181
181 -
 182
182 -
 183
183 -
 184
184 -
 185
185 -
 186
186 -
 187
187 -
 188
188 -
 189
189 -
 190
190 -
 191
191 -
 192
192 -
 193
193 -
 194
194 -
 195
195
 |
 |

Notes to the Consolidated Financial Statements (Continued)
37. Differences between International Financial Reporting Standards and U.S. Generally
Accepted Accounting Principles (Continued)
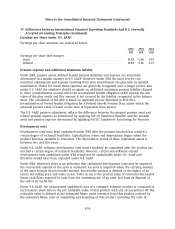
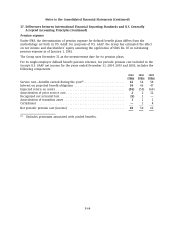
Compensation expense
As allowed by FAS 123, Accounting for Stock-Based Compensation (FAS 123), under U.S. GAAP the
Group has elected to continue to apply APB 25 and related interpretations in accounting for its
stock-based compensation plans. No stock-based employee compensation cost is reflected in net
income for options granted with an exercise price equal to the market value of the underlying
stock at the date of grant. Generally, options vest on the date they become exercisable. Restricted
shares vest upon the fulfilment on the employees’ service period. In addition to meeting the
criteria for the period of employment, performance shares do not vest until certain performance
criteria are also met.
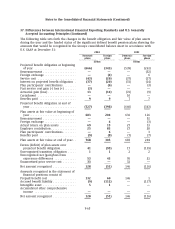
Had compensation cost for stock-based management incentive plans been determined based on
the fair value at the grant dates for options under that plan consistent with the method prescribed
in FAS 123, the Group’s net income and earnings per share would have been reduced to the pro
forma amounts indicated below:
2004 2003 2002
Net income under U.S. GAAP (EURm) .................... As reported 3,343 4,097 3,603
Add: Stock-based employee compensation expense included
in reported net income under U.S. GAAP, net of tax ....... 1320
Deduct: Total stock-based employee compensation expense
determined under fair value method for all awards, net of
tax ............................................. (116) (325) (467)
Net income under U.S. GAAP (EURm) .................... Pro forma 3,228 3,775 3,156
Basic earnings per share (EUR) ......................... As reported 0.73 0.86 0.76
Pro forma 0.70 0.79 0.67
Diluted earnings per share (EUR) ....................... As reported 0.73 0.86 0.75
Pro forma 0.70 0.79 0.66
Under FAS 123, pro forma disclosures are only required in relation to awards granted after
January 1, 1995. Nokia calculates the fair value of options using the Black Scholes model. The fair
value of the options is estimated on the date of grant with the following assumptions:
Weighted average assumptions 2004 2003 2002
Dividend yield .............................................. 2.44% 2.05% 1.13%
Expected volatility ........................................... 33% 35% 50%
Risk-free interest rate ........................................ 3.07% 2.80% 4.73%
Expected life (years) ......................................... 3.2 3.6 3.8
The weighted-average fair value of options granted was EUR 2.59 in 2004, EUR 3.48 in 2003 and
EUR 7.12 in 2002.
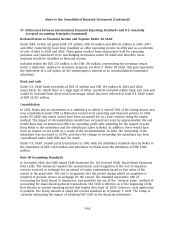
Deferred taxes
Under IFRS, the presentation of deferred taxes differs from the methodology set forth in U.S. GAAP.
For purposes of U.S. GAAP, deferred tax assets and liabilities must be classified either as current or
non-current based on the classification of the related non-tax asset or liability for financial
F-62