Nokia 2004 Annual Report Download - page 127
Download and view the complete annual report
Please find page 127 of the 2004 Nokia annual report below. You can navigate through the pages in the report by either clicking on the pages listed below, or by using the keyword search tool below to find specific information within the annual report.-
 1
1 -
2
-
3
-
4
-
5
-
6
-
7
-
8
-
9
-
10
-
11
-
12
-
13
-
14
-
15
-
16
-
17
-
18
-
19
-
20
-
21
-
22
-
23
-
24
-
25
-
26
-
27
-
28
-
29
-
30
-
31
-
32
-
33
-
34
-
35
-
36
-
37
-
38
-
39
-
40
-
41
-
42
-
43
-
44
-
45
-
46
-
47
-
48
-
49
-
50
-
51
-
52
-
53
-
54
-
55
-
56
-
57
-
58
-
59
-
60
-
61
-
62
-
63
-
64
-
65
-
66
-
67
-
68
-
69
-
70
-
71
-
72
-
73
-
74
-
75
-
76
-
77
-
78
-
79
-
80
-
81
-
82
-
83
-
84
-
85
-
86
-
87
-
88
-
89
-
90
-
91
-
92
-
93
-
94
-
95
-
96
-
97
-
98
-
99
-
100
-
101
-
102
-
103
-
104
-
105
-
106
-
107
-
108
-
109
-
110
-
111
-
112
-
113
-
114
-
115
-
116
-
 117
117 -
 118
118 -
 119
119 -
 120
120 -
 121
121 -
 122
122 -
 123
123 -
 124
124 -
 125
125 -
 126
126 -
 127
127 -
 128
128 -
 129
129 -
 130
130 -
 131
131 -
 132
132 -
 133
133 -
 134
134 -
 135
135 -
 136
136 -
 137
137 -
138
-
139
-
140
-
141
-
142
-
143
-
144
-
145
-
146
-
147
-
148
-
149
-
150
-
151
-
152
-
153
-
154
-
155
-
156
-
157
-
158
-
159
-
160
-
161
-
162
-
163
-
164
-
165
-
166
-
167
-
168
-
169
-
170
-
171
-
172
-
173
-
174
-
175
-
176
-
177
-
178
-
179
-
180
-
181
-
182
-
183
-
184
-
185
-
186
-
187
-
188
-
189
-
190
-
191
-
192
-
193
-
194
-
195
 |
 |

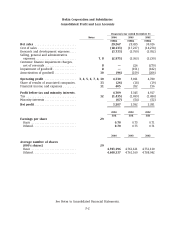
Nokia Corporation and Subsidiaries
Consolidated Profit and Loss Accounts
Financial year ended December 31
Notes 2004 2003 2002
EURm EURm EURm
Net sales ......................... 29,267 29,455 30,016
Cost of sales ....................... (18,133) (17,237) (18,278)
Research and development expenses .... (3,733) (3,760) (3,052)
Selling, general and administrative
expenses ........................ 7, 8 (2,975) (3,363) (3,239)
Customer finance impairment charges,
net of reversals ................... 8—226 (279)
Impairment of goodwill .............. 8—(151) (182)
Amortization of goodwill ............. 10 (96) (159) (206)
Operating profit ................... 3, 4, 5, 6, 7, 8, 10 4,330 5,011 4,780
Share of results of associated companies . 33 (26) (18) (19)
Financial income and expenses ........ 11 405 352 156
Profit before tax and minority interests .4,709 5,345 4,917
Tax .............................. 12 (1,435) (1,699) (1,484)
Minority interests ................... (67) (54) (52)
Net profit ......................... 3,207 3,592 3,381
2004 2003 2002
EUR EUR EUR
Earnings per share 29
Basic ........................... 0.70 0.75 0.71
Diluted .......................... 0.70 0.75 0.71
2004 2003 2002
Average number of shares
(000’s shares) 29
Basic ........................... 4,593,196 4,761,121 4,751,110
Diluted .......................... 4,600,337 4,761,160 4,788,042
See Notes to Consolidated Financial Statements.
F-2