Nokia 2004 Annual Report Download - page 70
Download and view the complete annual report
Please find page 70 of the 2004 Nokia annual report below. You can navigate through the pages in the report by either clicking on the pages listed below, or by using the keyword search tool below to find specific information within the annual report.-
 1
1 -
2
-
3
-
4
-
5
-
6
-
7
-
8
-
9
-
10
-
11
-
12
-
13
-
14
-
15
-
16
-
17
-
18
-
19
-
20
-
21
-
22
-
23
-
24
-
25
-
26
-
27
-
28
-
29
-
30
-
31
-
32
-
33
-
34
-
35
-
36
-
37
-
38
-
39
-
40
-
41
-
42
-
43
-
44
-
45
-
46
-
47
-
48
-
49
-
50
-
51
-
52
-
53
-
54
-
55
-
56
-
57
-
58
-
59
-
 60
60 -
 61
61 -
 62
62 -
 63
63 -
 64
64 -
 65
65 -
 66
66 -
 67
67 -
 68
68 -
 69
69 -
 70
70 -
 71
71 -
 72
72 -
 73
73 -
 74
74 -
 75
75 -
 76
76 -
 77
77 -
 78
78 -
 79
79 -
 80
80 -
81
-
82
-
83
-
84
-
85
-
86
-
87
-
88
-
89
-
90
-
91
-
92
-
93
-
94
-
95
-
96
-
97
-
98
-
99
-
100
-
101
-
102
-
103
-
104
-
105
-
106
-
107
-
108
-
109
-
110
-
111
-
112
-
113
-
114
-
115
-
116
-
117
-
118
-
119
-
120
-
121
-
122
-
123
-
124
-
125
-
126
-
127
-
128
-
129
-
130
-
131
-
132
-
133
-
134
-
135
-
136
-
137
-
138
-
139
-
140
-
141
-
142
-
143
-
144
-
145
-
146
-
147
-
148
-
149
-
150
-
151
-
152
-
153
-
154
-
155
-
156
-
157
-
158
-
159
-
160
-
161
-
162
-
163
-
164
-
165
-
166
-
167
-
168
-
169
-
170
-
171
-
172
-
173
-
174
-
175
-
176
-
177
-
178
-
179
-
180
-
181
-
182
-
183
-
184
-
185
-
186
-
187
-
188
-
189
-
190
-
191
-
192
-
193
-
194
-
195
 |
 |

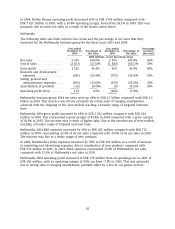
Nokia Networks operating loss increased to EUR 219 million in 2003 compared with an operating
loss of EUR 49 million in 2002. Nokia Networks operating margin was negative at -3.9% in 2003
and -0.7% in 2002. In 2003, Nokia Networks operating loss included the aforementioned EUR 470
million in restructuring costs, impairments and write-offs related to R&D, and, in addition,
restructuring costs in other functions of EUR 80 million. The operating loss in 2003 also included a
goodwill impairment of EUR 151 million in Nokia Networks’ Core Networks business in connection
with Amber Networks. This impairment was due to the negative future market outlook and the
decision to discontinue some of the related development projects. We have evaluated the carrying
value of goodwill arising from Amber Networks acquisition to determine if the carrying value
exceeds recoverable amounts. The impairment was calculated by comparing the discounted cash
flows of the relevant business to the carrying value of assets for this business. In addition, Nokia
Networks operating loss included a positive adjustment of EUR 226 million related to the customer
finance impairment in 2002 related to MobilCom. For a further discussion of the MobilCom loans,
see ‘‘Item 5.B Liquidity and Capital Resources—Customer Financing’’ and Notes 8 and 16 to our
consolidated financial statements.’’
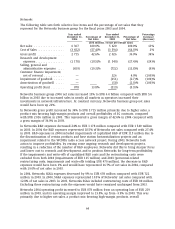
Nokia Ventures Organization
Nokia Ventures Organization Net Sales, Operating Profit
and Operating Margin
Year ended Year ended Percentage
December 31, December 31, Increase/
2003 2002 (decrease)
(EUR millions, except percentage data)
Net sales ......................................... 366 459 (20)%
Operating profit ................................... (161) (141) (14)%
Operating margin (%) ............................... (44.0%) (30.7%)
Net sales from Nokia Ventures Organization totaled EUR 366 million in 2003 compared with
EUR 459 million in 2002. Nokia Ventures Organization reported operating losses of EUR 161 million
in 2003 compared with EUR 141 million in 2002. Operating results included a net loss of EUR 27
million from Nokia Venture Partners investments mainly resulting from the impairment of certain
investments. In the first half of 2003, revenue at Nokia Internet Communications continued to be
affected by the slowdown in information technology spending. During the second half of 2003 the
market began to show signs of improvement. Enterprises continued to rank spending on corporate
network security as among their highest priorities, with positive effects on overall market growth
in 2003. Sales at Nokia Internet Communications were slightly lower in 2003, reflecting the
continued weakness of the US dollar. During 2003, Nokia Home Communications continued
renewing and broadening its product portfolio. However, the market for digital set top boxes
developed slower than expected leading in decrease in sales compared with 2002.
Common Group Expenses—This line item, which comprises Nokia Head Office, Nokia Research
Center and other general functions’ operating losses, totaled EUR 92 million in 2003, compared
with EUR 231 million in 2002. In 2003, this included a gain of EUR 56 million from the sale of the
remaining shares of Nokian Tyres. During 2002, the company’s investment in certain equity
securities suffered a permanent decline in value resulting in an impairment of available-for-sale
investments of EUR 55 million.
Net Financial Income
Net interest and other financial income totaled EUR 352 million in 2003 compared with EUR 156
million in 2002. Net financial income in 2003 resulted from a continued strong cash position
reflected in the negative net debt to equity ratio of -71% at December 31, 2003, compared with a
net debt to equity ratio of -61% at December 31, 2002. See ‘‘—Exchange Rates’’ below. At year-end
2003, we had cash and cash equivalents of EUR 11 296 million compared with EUR 9 351 million at
year-end 2002.
69