Nokia 2004 Annual Report Download - page 115
Download and view the complete annual report
Please find page 115 of the 2004 Nokia annual report below. You can navigate through the pages in the report by either clicking on the pages listed below, or by using the keyword search tool below to find specific information within the annual report.-
 1
1 -
2
-
3
-
4
-
5
-
6
-
7
-
8
-
9
-
10
-
11
-
12
-
13
-
14
-
15
-
16
-
17
-
18
-
19
-
20
-
21
-
22
-
23
-
24
-
25
-
26
-
27
-
28
-
29
-
30
-
31
-
32
-
33
-
34
-
35
-
36
-
37
-
38
-
39
-
40
-
41
-
42
-
43
-
44
-
45
-
46
-
47
-
48
-
49
-
50
-
51
-
52
-
53
-
54
-
55
-
56
-
57
-
58
-
59
-
60
-
61
-
62
-
63
-
64
-
65
-
66
-
67
-
68
-
69
-
70
-
71
-
72
-
73
-
74
-
75
-
76
-
77
-
78
-
79
-
80
-
81
-
82
-
83
-
84
-
85
-
86
-
87
-
88
-
89
-
90
-
91
-
92
-
93
-
94
-
95
-
96
-
97
-
98
-
99
-
100
-
101
-
102
-
103
-
104
-
 105
105 -
 106
106 -
 107
107 -
 108
108 -
 109
109 -
 110
110 -
 111
111 -
 112
112 -
 113
113 -
 114
114 -
 115
115 -
 116
116 -
 117
117 -
 118
118 -
 119
119 -
 120
120 -
 121
121 -
 122
122 -
 123
123 -
 124
124 -
 125
125 -
126
-
127
-
128
-
129
-
130
-
131
-
132
-
133
-
134
-
135
-
136
-
137
-
138
-
139
-
140
-
141
-
142
-
143
-
144
-
145
-
146
-
147
-
148
-
149
-
150
-
151
-
152
-
153
-
154
-
155
-
156
-
157
-
158
-
159
-
160
-
161
-
162
-
163
-
164
-
165
-
166
-
167
-
168
-
169
-
170
-
171
-
172
-
173
-
174
-
175
-
176
-
177
-
178
-
179
-
180
-
181
-
182
-
183
-
184
-
185
-
186
-
187
-
188
-
189
-
190
-
191
-
192
-
193
-
194
-
195
 |
 |

3MAR200520165827
Market Risk
Foreign Exchange Risk
Nokia operates globally and is thus exposed to foreign exchange risk arising from various currency
combinations. Foreign currency denominated assets and liabilities together with expected cash
flows from highly probable purchases and sales give rise to foreign exchange exposures. These
transaction exposures are managed against various local currencies because of Nokia’s substantial
production and sales outside the Eurozone.
Due to the changes in the business environment, currency combinations may also change within
the financial year. The most significant non-euro sales currencies during the year were US dollar
(USD), UK pound sterling (GBP) and Australian dollar (AUD). In general, depreciation of another
currency relative to the euro has an adverse effect on Nokia’s sales and operating profit, while
appreciation of another currency has a positive effect, with the exception of Japanese yen, being
the only significant foreign currency in which Nokia has more purchases than sales.
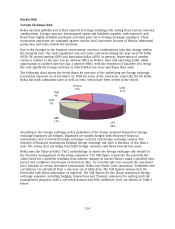
The following chart shows the break-down by currency of the underlying net foreign exchange
transaction exposure as of December 31, 2004 (in some of the currencies, especially the US dollar,
Nokia has both substantial sales as well as costs, which have been netted in the chart).
GBP
17%
AUD
5%
THB
4%
Others
17%
JPY
26%
USD
31%
According to the foreign exchange policy guidelines of the Group, material transaction foreign
exchange exposures are hedged. Exposures are mainly hedged with derivative financial
instruments such as forward foreign exchange contracts and foreign exchange options. The
majority of financial instruments hedging foreign exchange risk have a duration of less than a
year. The Group does not hedge forecasted foreign currency cash flows beyond two years.
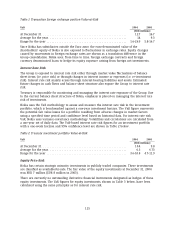
Nokia uses the Value-at-Risk (‘‘VaR’’) methodology to assess the foreign exchange risk related to
the Treasury management of the Group exposures. The VaR figure represents the potential fair
value losses for a portfolio resulting from adverse changes in market factors using a specified time
period and confidence level based on historical data. To correctly take into account the non-linear
price function of certain derivative instruments, Nokia uses Monte Carlo simulation. Volatilities and
correlations are calculated from a one-year set of daily data. The VaR figures assume that the
forecasted cash flows materialize as expected. The VaR figures for the Group transaction foreign
exchange exposure, including hedging transactions and Treasury exposures for netting and risk
management purposes, with a one-week horizon and 95% confidence level, are shown in Table 1
below.
114