Nokia 2004 Annual Report Download - page 72
Download and view the complete annual report
Please find page 72 of the 2004 Nokia annual report below. You can navigate through the pages in the report by either clicking on the pages listed below, or by using the keyword search tool below to find specific information within the annual report.-
 1
1 -
2
-
3
-
4
-
5
-
6
-
7
-
8
-
9
-
10
-
11
-
12
-
13
-
14
-
15
-
16
-
17
-
18
-
19
-
20
-
21
-
22
-
23
-
24
-
25
-
26
-
27
-
28
-
29
-
30
-
31
-
32
-
33
-
34
-
35
-
36
-
37
-
38
-
39
-
40
-
41
-
42
-
43
-
44
-
45
-
46
-
47
-
48
-
49
-
50
-
51
-
52
-
53
-
54
-
55
-
56
-
57
-
58
-
59
-
60
-
61
-
 62
62 -
 63
63 -
 64
64 -
 65
65 -
 66
66 -
 67
67 -
 68
68 -
 69
69 -
 70
70 -
 71
71 -
 72
72 -
 73
73 -
 74
74 -
 75
75 -
 76
76 -
 77
77 -
 78
78 -
 79
79 -
 80
80 -
 81
81 -
 82
82 -
83
-
84
-
85
-
86
-
87
-
88
-
89
-
90
-
91
-
92
-
93
-
94
-
95
-
96
-
97
-
98
-
99
-
100
-
101
-
102
-
103
-
104
-
105
-
106
-
107
-
108
-
109
-
110
-
111
-
112
-
113
-
114
-
115
-
116
-
117
-
118
-
119
-
120
-
121
-
122
-
123
-
124
-
125
-
126
-
127
-
128
-
129
-
130
-
131
-
132
-
133
-
134
-
135
-
136
-
137
-
138
-
139
-
140
-
141
-
142
-
143
-
144
-
145
-
146
-
147
-
148
-
149
-
150
-
151
-
152
-
153
-
154
-
155
-
156
-
157
-
158
-
159
-
160
-
161
-
162
-
163
-
164
-
165
-
166
-
167
-
168
-
169
-
170
-
171
-
172
-
173
-
174
-
175
-
176
-
177
-
178
-
179
-
180
-
181
-
182
-
183
-
184
-
185
-
186
-
187
-
188
-
189
-
190
-
191
-
192
-
193
-
194
-
195
 |
 |
depreciates, and affects shareholders’ equity adversely when the euro appreciates against the
relevant other currencies (year-end rate to previous year-end rate).
For a discussion on the instruments used by Nokia in connection with our hedging activities, see
Note 35 to our consolidated financial statements included in Item 18 of this Form 20-F. See also
‘‘Item 11. Quantitative and Qualitative Disclosures About Market Risk ‘‘and ‘‘Item 3.D Risk Factors—
Our sales, costs and results are affected by exchange rate fluctuations, particularly between the
euro, which is our reporting currency, and the US dollar, UK pound sterling and the Japanese yen
as well as certain other currencies.’’
Principal Differences Between IFRS and US GAAP
Nokia’s consolidated financial statements are prepared in accordance with IFRS.
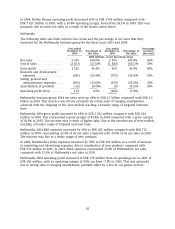
Our net profit in 2004 under IFRS was EUR 3 207 million compared with EUR 3 592 million in
2003 and EUR 3 381 million in 2002. Under US GAAP, Nokia would have reported net income of
EUR 3 343 million in 2004 compared with EUR 4 097 million in 2003 and EUR 3 603 million in
2002.
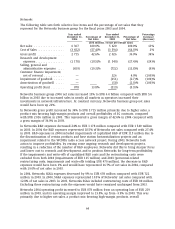
The principal differences between IFRS and US GAAP that affect our net profit or loss, as well as
our shareholders’ equity, relate to the treatment of development costs, impairment of capitalized
development costs, pension costs, provision for social security costs on stock options, stock
compensation expense, identifiable intangible assets acquired, amortization and impairment of
goodwill, translation of goodwill, net investment in foreign companies and certain cash flow
hedges. See Note 37 to our consolidated financial statements included in Item 18 of this Form 20-F
for a description of the principal differences between IFRS and US GAAP and for a description of
the anticipated impact on the consolidated financial statements of the adoption of recently issued
US GAAP accounting standards.
5.B Liquidity and Capital Resources
In 2003 and earlier, the Group maintained its excess cash in a single pool of highly liquid, low risk
instruments with varying maturity dates. These pooled instruments were originally presented as
cash equivalents irrespective of the instruments’ maturities. During 2004, cash management
practices were revised, such that this single pool was divided into two—one of instruments with
maturities of 90 days or less at the date of acquisition and the other of instruments with
maturities of more than 90 days at the date of acquisition.
This change was made in order for the Group to better manage its excess liquidity by enabling the
use of longer dated instruments where appropriate and by facilitating a wider range of
benchmarks for performance measurement and interest risk management purposes. Both pools
remain available to meet the Group’s cash commitments, and initially, both have similar highly
liquid and low risk profiles, with the pool of 90 day and under instruments treated as cash
equivalents and the pool of over 90 day instruments treated as available-for-sale investments,
liquid assets.
In the future the risk profile of the two pools may be different in line with the revised cash
management practices.
In connection with this change in its cash management practice, the Group re-evaluated its policy
for determining cash equivalents and concluded that EUR 8 512 million and EUR 5 678 million in
2003 and 2002, respectively, previously presented as cash equivalents should have been excluded
from that classification and instead presented as current available-for-sale investments, liquid
assets. For the purpose of this Annual Report on Form 20-F the Group has defined the change in its
accounts (IFRS) for this item as a restatement of prior period balances and the related activity in
71