Nokia 2004 Annual Report Download - page 73
Download and view the complete annual report
Please find page 73 of the 2004 Nokia annual report below. You can navigate through the pages in the report by either clicking on the pages listed below, or by using the keyword search tool below to find specific information within the annual report.-
 1
1 -
2
-
3
-
4
-
5
-
6
-
7
-
8
-
9
-
10
-
11
-
12
-
13
-
14
-
15
-
16
-
17
-
18
-
19
-
20
-
21
-
22
-
23
-
24
-
25
-
26
-
27
-
28
-
29
-
30
-
31
-
32
-
33
-
34
-
35
-
36
-
37
-
38
-
39
-
40
-
41
-
42
-
43
-
44
-
45
-
46
-
47
-
48
-
49
-
50
-
51
-
52
-
53
-
54
-
55
-
56
-
57
-
58
-
59
-
60
-
61
-
62
-
 63
63 -
 64
64 -
 65
65 -
 66
66 -
 67
67 -
 68
68 -
 69
69 -
 70
70 -
 71
71 -
 72
72 -
 73
73 -
 74
74 -
 75
75 -
 76
76 -
 77
77 -
 78
78 -
 79
79 -
 80
80 -
 81
81 -
 82
82 -
 83
83 -
84
-
85
-
86
-
87
-
88
-
89
-
90
-
91
-
92
-
93
-
94
-
95
-
96
-
97
-
98
-
99
-
100
-
101
-
102
-
103
-
104
-
105
-
106
-
107
-
108
-
109
-
110
-
111
-
112
-
113
-
114
-
115
-
116
-
117
-
118
-
119
-
120
-
121
-
122
-
123
-
124
-
125
-
126
-
127
-
128
-
129
-
130
-
131
-
132
-
133
-
134
-
135
-
136
-
137
-
138
-
139
-
140
-
141
-
142
-
143
-
144
-
145
-
146
-
147
-
148
-
149
-
150
-
151
-
152
-
153
-
154
-
155
-
156
-
157
-
158
-
159
-
160
-
161
-
162
-
163
-
164
-
165
-
166
-
167
-
168
-
169
-
170
-
171
-
172
-
173
-
174
-
175
-
176
-
177
-
178
-
179
-
180
-
181
-
182
-
183
-
184
-
185
-
186
-
187
-
188
-
189
-
190
-
191
-
192
-
193
-
194
-
195
 |
 |
the statement of cash flows for this item. For all other purposes of the publication of its annual
accounts under IFRS to shareholders, the Group concluded that the change did not constitute a
fundamental error as defined in IAS 8, but has reclassified cash equivalents in prior years to be
consistent with the 2004 classification. Accordingly, there are no differences in the classification of
cash equivalents between the annual accounts (IFRS) contained in this Form 20-F or otherwise
published by the Group. All references to cash and cash equivalent balances in 2003 and 2002 in
the statement of cash flows are to the restated amounts. Further details of the Group’s risk
management principles in relation to its excess liquidity are provided in Item 11 of this Form 20-F
and Note 35 to the financial statements.
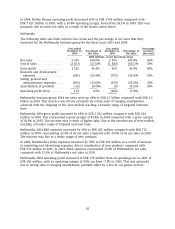
At December 31, 2004, Nokia’s cash and other liquid assets (bank and cash; available-for-sale
investments, cash equivalents; and available-for-sale investments, liquid assets) increased to
EUR 11 542 million, compared with EUR 11 296 million at December 31, 2003. Cash and other
liquid assets remained materially unchanged in spite of an increase in the purchases of treasury
shares.
Cash and cash equivalents decreased to EUR 2 457 million compared with EUR 2 784 million at
December 31, 2003. We hold our cash and cash equivalents predominantly in euros. Cash and cash
equivalents totaled EUR 3 673 million at December 31, 2002.
Net cash from operating activities was EUR 4 343 million in 2004 compared with
EUR 5 252 million in 2003, and EUR 5 701 million in 2002. In 2004, net cash generated from
operating activities decreased primarily due to lower profit partly offset by a reduction in working
capital. In 2003, net cash generated from operating activities decreased primarily due to high
year-end sales increasing receivables in working capital offset by a significant payment of 2001
taxes paid in 2002.
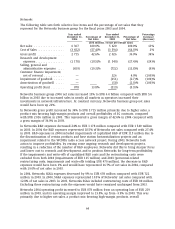
Net cash used in investing activities in 2004 was EUR 329 million compared with
EUR 3 215 million in 2003, and EUR 3 870 million in 2002. Cash flow from investing activities in
2004 included purchase of current available-for-sale investments, liquid assets, of
EUR 10 318 million, compared with EUR 11 695 million in 2003, and EUR 7 392 million in 2002.
Additions to capitalized R&D expenses totaled EUR 101 million, representing a decrease compared
with EUR 218 million in year 2003 and EUR 418 million in 2002. Long-term loans made to
customers decreased to EUR 0 million in 2004, compared with EUR 97 million in 2003 and
EUR 563 million in 2002. Capital expenditures for 2004 were EUR 548 million compared with
EUR 432 million in 2003 and 2002. Major items of capital expenditure included production lines,
test equipment and computer hardware used primarily in research and development as well as
office and manufacturing facilities. Proceeds from maturities and sale of current available-for-sale
investments, liquid assets, increased to EUR 9 737 million, compared with EUR 8 793 million in
2003, and EUR 4 390 million in 2002. During the year, we sold approximately 69% of the original
holdings in our subordinated convertible perpetual bonds issued by France Telecom. As a result
we booked proceeds from sale of current available-for-sale investments of EUR 587 million.
Net cash used in financing activities increased to EUR 4 318 million in 2004 compared with
EUR 2 780 million in 2003, primarily as a result of an increase in the purchases of treasury shares
with EUR 1 293 million and an increase in the repayment of short-term borrowings of
EUR 233 million. Net cash used in financing activities increased to EUR 2 780 million in 2003
compared with EUR 1 580 million in 2002, primarily as a result of an increase in the purchases of
treasury shares with EUR 1 338 million. Dividends paid increased to EUR 1 413 million in 2004
compared with EUR 1 378 million in 2003 and EUR 1 348 million in 2002.
At December 31, 2004, Nokia had EUR 19 million in long-term interest-bearing liabilities and
EUR 215 million in short-term borrowings, offset by EUR 11 542 million in cash and other liquid
assets, resulting in a liquid assets balance of EUR 11 308 million, compared with
72