Nokia 2004 Annual Report Download - page 168
Download and view the complete annual report
Please find page 168 of the 2004 Nokia annual report below. You can navigate through the pages in the report by either clicking on the pages listed below, or by using the keyword search tool below to find specific information within the annual report.-
 1
1 -
2
-
3
-
4
-
5
-
6
-
7
-
8
-
9
-
10
-
11
-
12
-
13
-
14
-
15
-
16
-
17
-
18
-
19
-
20
-
21
-
22
-
23
-
24
-
25
-
26
-
27
-
28
-
29
-
30
-
31
-
32
-
33
-
34
-
35
-
36
-
37
-
38
-
39
-
40
-
41
-
42
-
43
-
44
-
45
-
46
-
47
-
48
-
49
-
50
-
51
-
52
-
53
-
54
-
55
-
56
-
57
-
58
-
59
-
60
-
61
-
62
-
63
-
64
-
65
-
66
-
67
-
68
-
69
-
70
-
71
-
72
-
73
-
74
-
75
-
76
-
77
-
78
-
79
-
80
-
81
-
82
-
83
-
84
-
85
-
86
-
87
-
88
-
89
-
90
-
91
-
92
-
93
-
94
-
95
-
96
-
97
-
98
-
99
-
100
-
101
-
102
-
103
-
104
-
105
-
106
-
107
-
108
-
109
-
110
-
111
-
112
-
113
-
114
-
115
-
116
-
117
-
118
-
119
-
120
-
121
-
122
-
123
-
124
-
125
-
126
-
127
-
128
-
129
-
130
-
131
-
132
-
133
-
134
-
135
-
136
-
137
-
138
-
139
-
140
-
141
-
142
-
143
-
144
-
145
-
146
-
147
-
148
-
149
-
150
-
151
-
152
-
153
-
154
-
155
-
156
-
157
-
 158
158 -
 159
159 -
 160
160 -
 161
161 -
 162
162 -
 163
163 -
 164
164 -
 165
165 -
 166
166 -
 167
167 -
 168
168 -
 169
169 -
 170
170 -
 171
171 -
 172
172 -
 173
173 -
 174
174 -
 175
175 -
 176
176 -
 177
177 -
 178
178 -
179
-
180
-
181
-
182
-
183
-
184
-
185
-
186
-
187
-
188
-
189
-
190
-
191
-
192
-
193
-
194
-
195
 |
 |

Notes to the Consolidated Financial Statements (Continued)
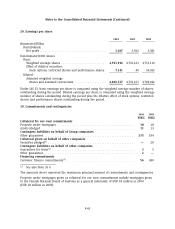
29. Earnings per share
2004 2003 2002
Numerator/EURm
Basic/Diluted:
Net profit ........................................ 3,207 3,592 3,381
Denominator/1000 shares
Basic:
Weighted average shares ........................... 4,593,196 4,761,121 4,751,110
Effect of dilutive securities:
stock options, restricted shares and performance shares . 7,141 40 36,932
Diluted:
Adjusted weighted average
shares and assumed conversions ................... 4,600,337 4,761,161 4,788,042
Under IAS 33, basic earnings per share is computed using the weighted average number of shares
outstanding during the period. Diluted earnings per share is computed using the weighted average
number of shares outstanding during the period plus the dilutive effect of stock options, restricted
shares and performance shares outstanding during the period.
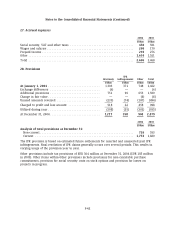
30. Commitments and contingencies
2004 2003
EURm EURm
Collateral for our own commitments
Property under mortgages ............................................... 18 18
Assets pledged ........................................................ 11 13
Contingent liabilities on behalf of Group companies
Other guarantees ...................................................... 275 184
Collateral given on behalf of other companies
Securities pledged(1) .................................................... —28
Contingent liabilities on behalf of other companies
Guarantees for loans(1) .................................................. 35
Other guarantees ...................................................... 2—
Financing commitments
Customer finance commitments(1) ......................................... 56 490
(1) See also Note 35 b
The amounts above represent the maximum principal amount of commitments and contingencies.
Property under mortgages given as collateral for our own commitments include mortgages given
to the Finnish National Board of Customs as a general indemnity of EUR 18 million in 2004
(EUR 18 million in 2003).
F-43