Lexmark 2013 Annual Report Download - page 90
Download and view the complete annual report
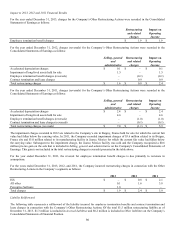
Please find page 90 of the 2013 Lexmark annual report below. You can navigate through the pages in the report by either clicking on the pages listed below, or by using the keyword search tool below to find specific information within the annual report.-
 1
1 -
2
-
3
-
4
-
5
-
6
-
7
-
8
-
9
-
10
-
11
-
12
-
13
-
14
-
15
-
16
-
17
-
18
-
19
-
20
-
21
-
22
-
23
-
24
-
25
-
26
-
27
-
28
-
29
-
30
-
31
-
32
-
33
-
34
-
35
-
36
-
37
-
38
-
39
-
40
-
41
-
42
-
43
-
44
-
45
-
46
-
47
-
48
-
49
-
50
-
51
-
52
-
53
-
54
-
55
-
56
-
57
-
58
-
59
-
60
-
61
-
62
-
63
-
64
-
65
-
66
-
67
-
68
-
69
-
70
-
71
-
72
-
73
-
74
-
75
-
76
-
77
-
78
-
79
-
 80
80 -
 81
81 -
 82
82 -
 83
83 -
 84
84 -
 85
85 -
 86
86 -
 87
87 -
 88
88 -
 89
89 -
 90
90 -
 91
91 -
 92
92 -
 93
93 -
 94
94 -
 95
95 -
 96
96 -
 97
97 -
 98
98 -
 99
99 -
 100
100 -
101
-
102
-
103
-
104
-
105
-
106
-
107
-
108
-
109
-
110
-
111
-
112
-
113
-
114
-
115
-
116
-
117
-
118
-
119
-
120
-
121
-
122
-
123
-
124
-
125
-
126
-
127
-
128
-
129
-
130
-
131
-
132
-
133
-
134
-
135
-
136
-
137
-
138
-
139
-
140
-
141
-
142
-
143
-
144
-
145
-
146
-
147
-
148
-
149
-
150
-
151
-
152
 |
 |

86
Derivatives
The Company employs a foreign currency and interest rate risk management strategy that periodically utilizes derivative instruments
to protect its interests from unanticipated fluctuations in earnings and cash flows caused by volatility in currency exchange rates and
interest rates. Fair values for the Company’s derivative financial instruments are based on pricing models or formulas using current
market data. Variables used in the calculations include forward points, spot rates and benchmark interest rates at the time of valuation,
as well as the frequency of payments to and from counterparties and effective and termination dates. Because of the very short
duration of the Company’s transactional hedges there is minimal risk of nonperformance. At December 31, 2013 and 2012, all of the
Company’s derivative instruments were designated as Level 2 measurements in the fair value hierarchy. Refer to Note 18 of the Notes
to Consolidated Financial Statements for more information regarding the Company’s derivatives.
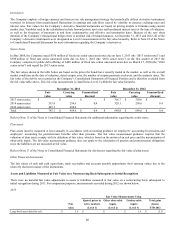
Senior Notes
In May 2008, the Company issued $350 million of fixed rate senior unsecured notes due on June 1, 2013 (the “2013 senior notes”) and
$300 million of fixed rate senior unsecured notes due on June 1, 2018 (the “2018 senior notes”). In the first quarter of 2013 the
Company completed a public debt offering of $400 million of fixed rate senior unsecured notes due on March 15, 2020 (the “2020
senior notes”) and repaid the 2013 senior notes.
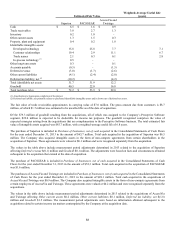
The fair values shown in the table below are based on the prices the bonds have recently traded in the market, as well as the overall
market conditions on the date of valuation, stated coupon rates, the number of coupon payments each year, and the maturity dates. The
fair value of the debt is not recorded on the Company’s Consolidated Statements of Financial Position and is therefore excluded from
the fair value table above. This fair value measurement is classified as Level 2 within the fair value hierarchy.
December 31, 2013 December 31, 2012
Fair Carrying Unamortized Fair Carrying Unamortized
value value discount value value discount
2013 senior notes $ – $ – $ – $ 356.7 $ 350.0 $ –
2018 senior notes 335.8 299.6 0.4 328.1 299.6 0.4
2020 senior notes 409.3 400.0 – – – –
Total $ 745.1 $ 699.6 $ 0.4 $ 684.8 $ 649.6 $ 0.4
Refer to Note 13 of the Notes to Consolidated Financial Statements for additional information regarding the senior notes.
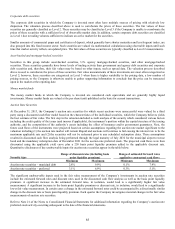
Plan assets
Plan assets must be measured at least annually in accordance with accounting guidance on employers’ accounting for pensions and
employers’ accounting for postretirement benefits other than pensions. The fair value measurement guidance requires that the
valuation of plan assets comply with its definition of fair value, which is based on the notion of an exit price and the maximization of
observable inputs. The fair value measurement guidance does not apply to the calculation of pension and postretirement obligations
since the liabilities are not measured at fair value.
Refer to Note 17 of the Notes to Consolidated Financial Statements for disclosures regarding the fair value of plan assets.
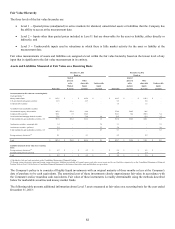
Other Financial Instruments
The fair values of cash and cash equivalents, trade receivables and accounts payable approximate their carrying values due to the
relatively short-term nature of the instruments.
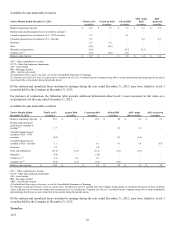
Assets and Liabilities Measured at Fair Value on a Nonrecurring Basis Subsequent to Initial Recognition
There were no material fair value adjustments to assets or liabilities measured at fair value on a nonrecurring basis subsequent to
initial recognition during 2013. For comparison purposes, measurements recorded during 2012 are shown below.
2012
Fair Value Measurements Using
Quoted prices in Other observable Unobservable Total gains
Fair active markets inputs inputs (losses)
value (Level 1) (Level 2) (Level 3) YTD 2012
Long-lived assets held for sale $ 1.6 $ – $ – $ 1.6 $ (2.1)
86