Lexmark 2013 Annual Report Download - page 134
Download and view the complete annual report
Please find page 134 of the 2013 Lexmark annual report below. You can navigate through the pages in the report by either clicking on the pages listed below, or by using the keyword search tool below to find specific information within the annual report.-
 1
1 -
2
-
3
-
4
-
5
-
6
-
7
-
8
-
9
-
10
-
11
-
12
-
13
-
14
-
15
-
16
-
17
-
18
-
19
-
20
-
21
-
22
-
23
-
24
-
25
-
26
-
27
-
28
-
29
-
30
-
31
-
32
-
33
-
34
-
35
-
36
-
37
-
38
-
39
-
40
-
41
-
42
-
43
-
44
-
45
-
46
-
47
-
48
-
49
-
50
-
51
-
52
-
53
-
54
-
55
-
56
-
57
-
58
-
59
-
60
-
61
-
62
-
63
-
64
-
65
-
66
-
67
-
68
-
69
-
70
-
71
-
72
-
73
-
74
-
75
-
76
-
77
-
78
-
79
-
80
-
81
-
82
-
83
-
84
-
85
-
86
-
87
-
88
-
89
-
90
-
91
-
92
-
93
-
94
-
95
-
96
-
97
-
98
-
99
-
100
-
101
-
102
-
103
-
104
-
105
-
106
-
107
-
108
-
109
-
110
-
111
-
112
-
113
-
114
-
115
-
116
-
117
-
118
-
119
-
120
-
121
-
122
-
123
-
 124
124 -
 125
125 -
 126
126 -
 127
127 -
 128
128 -
 129
129 -
 130
130 -
 131
131 -
 132
132 -
 133
133 -
 134
134 -
 135
135 -
 136
136 -
 137
137 -
 138
138 -
 139
139 -
 140
140 -
 141
141 -
 142
142 -
 143
143 -
 144
144 -
145
-
146
-
147
-
148
-
149
-
150
-
151
-
152
 |
 |

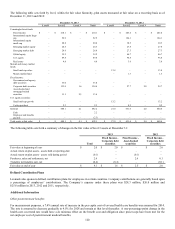
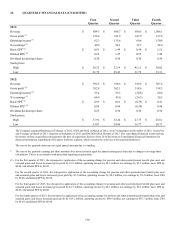
22. QUARTERLY FINANCIAL DATA (UNAUDITED)
First Second Third Fourth
Quarter Quarter Quarter Quarter
2013:
Revenue $ 884.3 $ 886.7 $ 890.5 $ 1,006.1
Gross profit (1) 336.4 341.9 347.9 417.8
Operating income (1) 62.3 135.6 60.6 150.8
Net earnings (1) 40.0 94.1 33.7 94.0
Basic EPS* (1) $ 0.63 $ 1.49 $ 0.54 $ 1.51
Diluted EPS* (1) 0.62 1.47 0.53 1.48
Dividend declared per share 0.30 0.30 0.30 0.30
Stock prices:
High $ 28.32 $ 32.19 $ 41.11 $ 38.02
Low 21.79 25.45 31.79 33.31
2012:
Revenue $ 992.5 $ 918.6 $ 919.2 $ 967.4
Gross profit (2) 382.8 362.1 318.6 338.3
Operating income (2) 95.4 66.3 (30.8) 60.6
Net earnings (2) 64.6 43.0 (26.3) 26.3
Basic EPS* (2) $ 0.91 $ 0.61 $ (0.39) $ 0.41
Diluted EPS* (2) 0.89 0.60 (0.38) 0.40
Dividend declared per share 0.25 0.30 0.30 0.30
Stock prices:
High $ 37.91 $ 33.24 $ 27.75 $ 25.61
Low 33.07 24.86 16.77 20.73
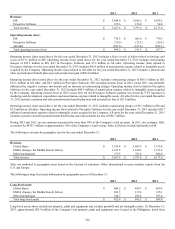
The Company acquired Brainware in February of 2012, ISYS and Nolij in March of 2012, Acuo Technologies in December of 2012, AccessVia
and Twistage in March of 2013, Saperion in September of 2013 and PACSGEAR in October of 2013. The consolidated financial results include
the results of these acquisitions subsequent to the date of acquisition. Refer to Note 20 of the Notes to Consolidated Financial Statements for
financial information regarding the Perceptive Software segment, which includes the activities of all acquired businesses.
The sum of the quarterly data may not equal annual amounts due to rounding.
* The sum of the quarterly earnings per share amounts does not necessarily equal the annual earnings per share due to changes in average share
calculations. This is in accordance with prescribed reporting requirements.
(1) For the first quarter of 2013, the retrospective application of the accounting change for pension and other postretirement benefit plan asset and
actuarial gains and losses increased gross profit by $1.8 million, operating income by $8.3 million, net earnings by $5.2 million, basic EPS by
$0.08, and diluted EPS by $0.09.
For the second quarter of 2013, the retrospective application of the accounting change for pension and other postretirement benefit plan asset
and actuarial gains and losses increased gross profit by $1.7 million, operating income by $8.3 million, net earnings by $5.2 million, basic EPS
by $0.08, and diluted EPS by $0.08.
For the third quarter of 2013, the retrospective application of the accounting change for pension and other postretirement benefit plan asset and
actuarial gains and losses increased gross profit by $1.7 million, operating income by $8.3 million, net earnings by $5.2 million, basic EPS by
$0.09, and diluted EPS by $0.08.
For the fourth quarter of 2013, the retrospective application of the accounting change for pension and other postretirement benefit plan asset and
actuarial gains and losses increased gross profit by $19.2 million, operating income by $90.9 million, net earnings by $55.7 million, basic EPS
by $0.89, and diluted EPS by $0.88.
130