Lexmark 2013 Annual Report Download - page 55
Download and view the complete annual report
Please find page 55 of the 2013 Lexmark annual report below. You can navigate through the pages in the report by either clicking on the pages listed below, or by using the keyword search tool below to find specific information within the annual report.-
 1
1 -
2
-
3
-
4
-
5
-
6
-
7
-
8
-
9
-
10
-
11
-
12
-
13
-
14
-
15
-
16
-
17
-
18
-
19
-
20
-
21
-
22
-
23
-
24
-
25
-
26
-
27
-
28
-
29
-
30
-
31
-
32
-
33
-
34
-
35
-
36
-
37
-
38
-
39
-
40
-
41
-
42
-
43
-
44
-
 45
45 -
 46
46 -
 47
47 -
 48
48 -
 49
49 -
 50
50 -
 51
51 -
 52
52 -
 53
53 -
 54
54 -
 55
55 -
 56
56 -
 57
57 -
 58
58 -
 59
59 -
 60
60 -
 61
61 -
 62
62 -
 63
63 -
 64
64 -
 65
65 -
66
-
67
-
68
-
69
-
70
-
71
-
72
-
73
-
74
-
75
-
76
-
77
-
78
-
79
-
80
-
81
-
82
-
83
-
84
-
85
-
86
-
87
-
88
-
89
-
90
-
91
-
92
-
93
-
94
-
95
-
96
-
97
-
98
-
99
-
100
-
101
-
102
-
103
-
104
-
105
-
106
-
107
-
108
-
109
-
110
-
111
-
112
-
113
-
114
-
115
-
116
-
117
-
118
-
119
-
120
-
121
-
122
-
123
-
124
-
125
-
126
-
127
-
128
-
129
-
130
-
131
-
132
-
133
-
134
-
135
-
136
-
137
-
138
-
139
-
140
-
141
-
142
-
143
-
144
-
145
-
146
-
147
-
148
-
149
-
150
-
151
-
152
 |
 |

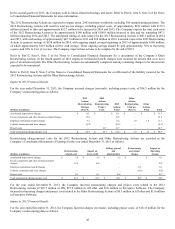
Changes in Accounts payable balances contributed $72.6 million to the increase in cash flow from operating activities from 2011 to
2012. Accounts payable increased $22.0 million in 2012 while they decreased $50.6 million in 2011. The increase in 2012 is driven by
the longer payment cycle.
Inventories decreased $58.2 million in 2012 while they decreased $30.6 million in 2011. This $27.6 million improvement reflects
improved inventory management.
The activities above were partially offset by the following factors.
Net Earnings decreased $167.6 million for the full year 2012 as compared to the full year 2011. However, the YTY decrease in Net
Earnings was affected by a YTY increase in depreciation and amortization as well as other charges related to restructuring actions not
funded during 2012. Conversely, Net Earnings was also affected by the $65.8 million decrease in the non-cash Pension and other
postretirement (income) expense.
Trade receivables balances increased $57.2 million in 2012 while they decreased $24.0 million in 2011, excluding receivables
recognized from business combinations. This $81.2 million fluctuation between the activity in 2012 and that of 2011 is driven largely
by increased delinquencies as well as an increase in days sales outstanding. The increase in days sales outstanding reflects the
changing mix of the Company’s business toward solutions, software and MPS, which have longer collection periods than traditional
hardware and supplies.
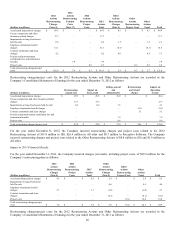
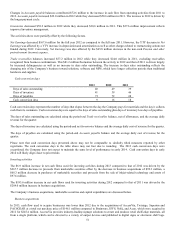
Cash conversion days
2013 2012 2011
Days of sales outstanding 40 49 39
Days of inventory 41 39 46
Days of payables 73 72 68
Cash conversion days 9 16 18
Cash conversion days represent the number of days that elapse between the day the Company pays for materials and the day it collects
cash from its customers. Cash conversion days are equal to the days of sales outstanding plus days of inventory less days of payables.
The days of sales outstanding are calculated using the period-end Trade receivables balance, net of allowances, and the average daily
revenue for the quarter.
The days of inventory are calculated using the period-end net Inventories balance and the average daily cost of revenue for the quarter.
The days of payables are calculated using the period-end Accounts payable balance and the average daily cost of revenue for the
quarter.
Please note that cash conversion days presented above may not be comparable to similarly titled measures reported by other
registrants. The cash conversion days in the table above may not foot due to rounding. The 2013 cash conversion days were
exceptional; the Company does not expect to maintain the same level of performance in early 2014. Cash conversion days in early
2014 will likely align closer to prior trends.
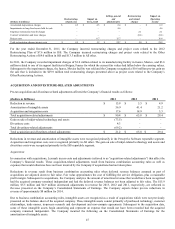
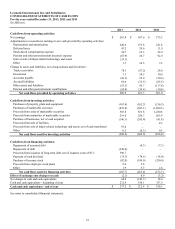
Investing activities
The $6.9 million increase in net cash flows used for investing activities during 2013 compared to that of 2012 was driven by the
$267.7 million decrease in proceeds from marketable securities offset by the decrease in business acquisitions of $99.3 million, a
$68.3 million decrease in purchases of marketable securities and proceeds from the sale of inkjet-related technology and assets of
$97.6 million.
The $195.6 million increase in net cash flows used for investing activities during 2012 compared to that of 2011 was driven by the
$204.0 million increase in business acquisitions.
The Company’s business acquisitions, marketable securities and capital expenditures are discussed below.
Business acquisitions
In 2013, cash flow used to acquire businesses was lower than 2012 due to the acquisitions of AccessVia, Twistage, Saperion and
PACSGEAR at a total net purchase price of $146.1 million compared to Brainware, ISYS, Nolij, and Acuo, which were acquired in
2012 for $245.4 million. AccessVia provides industry-leading signage solutions to create and produce retail shelf-edge materials, all
from a single platform, which can be directed to a variety of output devices and published to digital signs or electronic shelf tags.
51