Lexmark 2013 Annual Report Download - page 118
Download and view the complete annual report
Please find page 118 of the 2013 Lexmark annual report below. You can navigate through the pages in the report by either clicking on the pages listed below, or by using the keyword search tool below to find specific information within the annual report.-
 1
1 -
2
-
3
-
4
-
5
-
6
-
7
-
8
-
9
-
10
-
11
-
12
-
13
-
14
-
15
-
16
-
17
-
18
-
19
-
20
-
21
-
22
-
23
-
24
-
25
-
26
-
27
-
28
-
29
-
30
-
31
-
32
-
33
-
34
-
35
-
36
-
37
-
38
-
39
-
40
-
41
-
42
-
43
-
44
-
45
-
46
-
47
-
48
-
49
-
50
-
51
-
52
-
53
-
54
-
55
-
56
-
57
-
58
-
59
-
60
-
61
-
62
-
63
-
64
-
65
-
66
-
67
-
68
-
69
-
70
-
71
-
72
-
73
-
74
-
75
-
76
-
77
-
78
-
79
-
80
-
81
-
82
-
83
-
84
-
85
-
86
-
87
-
88
-
89
-
90
-
91
-
92
-
93
-
94
-
95
-
96
-
97
-
98
-
99
-
100
-
101
-
102
-
103
-
104
-
105
-
106
-
107
-
 108
108 -
 109
109 -
 110
110 -
 111
111 -
 112
112 -
 113
113 -
 114
114 -
 115
115 -
 116
116 -
 117
117 -
 118
118 -
 119
119 -
 120
120 -
 121
121 -
 122
122 -
 123
123 -
 124
124 -
 125
125 -
 126
126 -
 127
127 -
 128
128 -
129
-
130
-
131
-
132
-
133
-
134
-
135
-
136
-
137
-
138
-
139
-
140
-
141
-
142
-
143
-
144
-
145
-
146
-
147
-
148
-
149
-
150
-
151
-
152
 |
 |

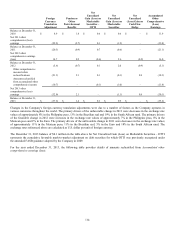
Net
Unrealized Net Net Accumulated
Forei
g
n Pension or Gain
(
Loss
)
on Unrealized Unrealized Other
Currenc
y
Other Marketable Gain
(
Loss
)
on
(
Loss
)
Gain on Com
p
rehensive
Translation Postretirement Securities
–
Marketable Cash Flow
(
Loss
)
Ad
j
ustment Benefits OTTI Securities Hed
g
e Earnin
g
s
Balance at December 31,
2010 $ 8.9 $ 1.8 $ 0.6 $ 0.6 $ – $ 11.9
Net 2011 other
comprehensive (loss)
earnings (29.2) (2.7) 0.1 (1.2) – (33.0)
Balance at December 31,
2011 (20.3) (0.9) 0.7 (0.6) – (21.1)
Net 2012 other
comprehensive earnings
(loss) 14.7 0.2 (0.6) 2.6 (0.9) 16.0
Balance at December 31,
2012 (5.6) (0.7) 0.1 2.0 (0.9) (5.1)
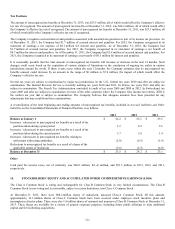
Other comprehensive
income before
reclassifications (21.3) 2.1 0.1 (0.1) 0.9 (18.3)
Amounts reclassified
from accumulated other
comprehensive income (10.7) – (0.1) (1.0) – (11.8)
Net 2013 other
comprehensive (loss)
earnings (32.0) 2.1 – (1.1) 0.9 (30.1)
Balance at December 31,
2013 $ (37.6) $ 1.4 $ 0.1 $ 0.9 $ – $ (35.2)
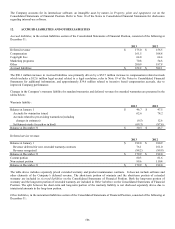
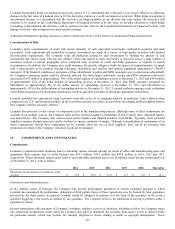
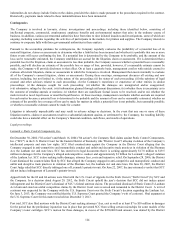
Changes in the Company's foreign currency translation adjustments were due to a number of factors as the Company operates in
various currencies throughout the world. The primary drivers of the unfavorable change in 2013 were decreases in the exchange rate
values of approximately 8% in the Philippine peso, 13% in the Brazilian real and 19% in the South African rand. The primary drivers
of the favorable change in 2012 were increases in the exchange rate values of approximately 7% in the Philippine peso, 8% in the
Mexican peso and 2% in the Euro. The primary drivers of the unfavorable change in 2011 were decreases in the exchange rate values
of approximately 11% in the Mexican peso, 11% in the Brazilian real, 3% in the Euro and 18% in the South African rand. The
exchange rates referenced above are calculated as U.S. dollar per unit of foreign currency.
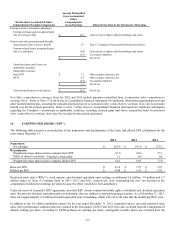
The December 31, 2013 balance of $0.1 million in the table above for Net Unrealized Gain (Loss) on Marketable Securities – OTTI
represents the cumulative favorable mark-to-market adjustment on debt securities for which OTTI was previously recognized under
the amended FASB guidance adopted by the Company in 2009.
For the year ended December 31, 2013, the following table provides details of amounts reclassified from Accumulated other
comprehensive earnings (loss):
114