Lexmark 2013 Annual Report Download - page 38
Download and view the complete annual report
Please find page 38 of the 2013 Lexmark annual report below. You can navigate through the pages in the report by either clicking on the pages listed below, or by using the keyword search tool below to find specific information within the annual report.-
 1
1 -
2
-
3
-
4
-
5
-
6
-
7
-
8
-
9
-
10
-
11
-
12
-
13
-
14
-
15
-
16
-
17
-
18
-
19
-
20
-
21
-
22
-
23
-
24
-
25
-
26
-
27
-
 28
28 -
 29
29 -
 30
30 -
 31
31 -
 32
32 -
 33
33 -
 34
34 -
 35
35 -
 36
36 -
 37
37 -
 38
38 -
 39
39 -
 40
40 -
 41
41 -
 42
42 -
 43
43 -
 44
44 -
 45
45 -
 46
46 -
 47
47 -
 48
48 -
49
-
50
-
51
-
52
-
53
-
54
-
55
-
56
-
57
-
58
-
59
-
60
-
61
-
62
-
63
-
64
-
65
-
66
-
67
-
68
-
69
-
70
-
71
-
72
-
73
-
74
-
75
-
76
-
77
-
78
-
79
-
80
-
81
-
82
-
83
-
84
-
85
-
86
-
87
-
88
-
89
-
90
-
91
-
92
-
93
-
94
-
95
-
96
-
97
-
98
-
99
-
100
-
101
-
102
-
103
-
104
-
105
-
106
-
107
-
108
-
109
-
110
-
111
-
112
-
113
-
114
-
115
-
116
-
117
-
118
-
119
-
120
-
121
-
122
-
123
-
124
-
125
-
126
-
127
-
128
-
129
-
130
-
131
-
132
-
133
-
134
-
135
-
136
-
137
-
138
-
139
-
140
-
141
-
142
-
143
-
144
-
145
-
146
-
147
-
148
-
149
-
150
-
151
-
152
 |
 |

34
significant portion of the assets and liabilities relating to the Company’s pension plans. The investment goal of the U.S. pension plan
is to achieve an adequate net investment return in order to provide for future benefit payments to its participants. U.S. asset allocation
percentages as of December 31, 2013 were 40% equity and 60% fixed income investments. The U.S. pension plan employs
professional investment managers to invest in U.S. equity, global equity, international developed equity, emerging market equity, U.S.
fixed income, high yield bonds and emerging market debt. Each investment manager operates under an investment management
contract that includes specific investment guidelines, requiring among other actions, adequate diversification, prudent use of
derivatives and standard risk management practices such as portfolio constraints relating to established benchmarks. The U.S. pension
plan currently uses a combination of both active management and passive index funds to achieve its investment goals.
The accounting guidance for employers’ defined benefit pension and other postretirement plans requires recognition of the funded
status of a benefit plan in the statement of financial position. The change in the fair value of plan assets and net actuarial gains and
losses are recognized in net periodic benefit cost in the fourth quarter of each year and whenever a remeasurement is triggered. The
remaining components of pension and other postretirement benefit cost are recorded on a quarterly basis. Actuarial gains and losses
may be related to actual results that differ from assumptions as well as changes in assumptions, which may occur each year. Factors
that can significantly impact the amounts of such gains and losses include differences between the actual and expected return on plan
assets, changes in discount rates used in the measurement of pension and other postretirement plan obligations each year, and changes
in actuarial assumptions, such as plan participants’ life expectancy. Prior service cost or credit will continue to be accumulated in
other comprehensive earnings and amortized over the estimated future service period of active plan participants.
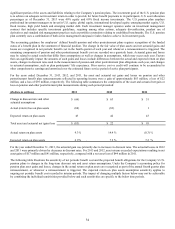
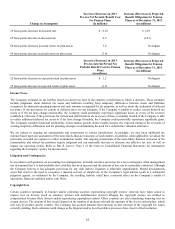
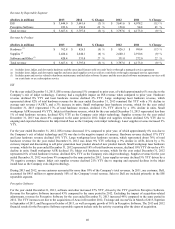
For the years ended December 31, 2013, 2012, and 2011, the asset and actuarial net gains and losses on pension and other
postretirement benefit plan remeasurements reflected in operating income were a gain of approximately $83 million, a loss of $22
million, and a loss of $95 million, respectively. The following table summarizes the components of the asset and actuarial net gain or
loss on pension and other postretirement plan measurements during each period presented:
(Dollars in millions) 2013 2012 2011
Change in discount rate and other $ (66) $ 63 $ 51
Actual (return) loss on plan assets (60) (83) 1
Expected return on plan assets 43 42 43
Total asset and actuarial net (gain) loss $ (83) $ 22 $ 95
Actual return on plan assets 9.3 % 14.4 % (0.3) %
Expected return on plan assets 6 .9 % 7 .2 % 7.2 %
For the year ended December 31, 2013, the actuarial gain was primarily due to increases in discount rates. The actuarial losses in 2012
and 2011 were primarily driven by decreases in discount rates. For 2013 and 2012, asset returns exceeded expectations resulting in net
asset gains of $17 million and $41 million, respectively, compared with a net asset loss of $44 million in 2011.
The following table illustrates the sensitivity of net periodic benefit cost and the projected benefit obligations for the Company’s U.S.
pension plans to changes in the long-term discount rate and asset return assumptions. Under the Company’s accounting policy for
pension plan asset gains and losses, changes in the actual return on plan assets are recognized as part of the annual fourth quarter plan
remeasurement, or whenever a remeasurement is triggered. The expected return on plan assets assumption sensitivity applies to
ongoing net periodic benefit cost recorded in interim periods. The impact of changing multiple factors below may not be achievable
by combining the individual sensitivities provided below and such sensitivities are specific to the below time periods.
34
actuarial assumptions