Lexmark 2013 Annual Report Download - page 45
Download and view the complete annual report
Please find page 45 of the 2013 Lexmark annual report below. You can navigate through the pages in the report by either clicking on the pages listed below, or by using the keyword search tool below to find specific information within the annual report.-
 1
1 -
2
-
3
-
4
-
5
-
6
-
7
-
8
-
9
-
10
-
11
-
12
-
13
-
14
-
15
-
16
-
17
-
18
-
19
-
20
-
21
-
22
-
23
-
24
-
25
-
26
-
27
-
28
-
29
-
30
-
31
-
32
-
33
-
34
-
 35
35 -
 36
36 -
 37
37 -
 38
38 -
 39
39 -
 40
40 -
 41
41 -
 42
42 -
 43
43 -
 44
44 -
 45
45 -
 46
46 -
 47
47 -
 48
48 -
 49
49 -
 50
50 -
 51
51 -
 52
52 -
 53
53 -
 54
54 -
 55
55 -
56
-
57
-
58
-
59
-
60
-
61
-
62
-
63
-
64
-
65
-
66
-
67
-
68
-
69
-
70
-
71
-
72
-
73
-
74
-
75
-
76
-
77
-
78
-
79
-
80
-
81
-
82
-
83
-
84
-
85
-
86
-
87
-
88
-
89
-
90
-
91
-
92
-
93
-
94
-
95
-
96
-
97
-
98
-
99
-
100
-
101
-
102
-
103
-
104
-
105
-
106
-
107
-
108
-
109
-
110
-
111
-
112
-
113
-
114
-
115
-
116
-
117
-
118
-
119
-
120
-
121
-
122
-
123
-
124
-
125
-
126
-
127
-
128
-
129
-
130
-
131
-
132
-
133
-
134
-
135
-
136
-
137
-
138
-
139
-
140
-
141
-
142
-
143
-
144
-
145
-
146
-
147
-
148
-
149
-
150
-
151
-
152
 |
 |

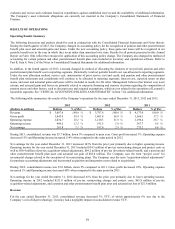
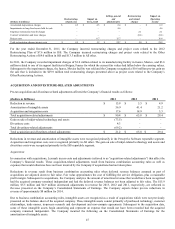
For the year ended December 31, 2012, software and other increased 22% YTY, driven by the YTY growth in Perceptive Software.
Revenue for Perceptive Software increased 65% compared to the same period in 2011. Excluding the impact of acquisition-related
adjustments, revenue for Perceptive Software for the year ended December 31, 2012 increased 62% compared to the same period in
2011. The YTY increases are due to the acquisitions of Pallas Athena in the fourth quarter of 2011, Brainware, ISYS and Nolij in the
first quarter of 2012 as well as organic growth of 21% in Perceptive Software. The 2012 and 2011 financial results for the Perceptive
Software reportable segment include only the activity occurring after the dates of acquisition.
Reductions in revenue result from business combination accounting rules when deferred revenue balances assumed as part of
acquisitions are adjusted down to fair value. Fair value approximates the cost of fulfilling the service obligation, plus a reasonable
profit margin. Subsequent to acquisitions, the Company analyzes the amount of amortized revenue that would have been recognized
had the acquired company remained independent and had the deferred revenue balances not been adjusted to fair value.
See “Acquisition-related Adjustments” section that follows for further discussion.
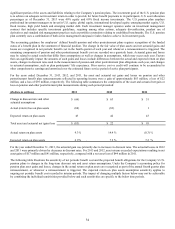
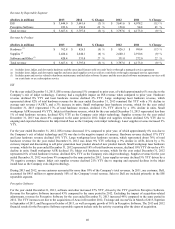
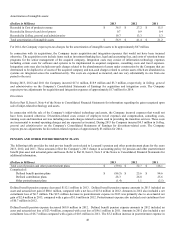
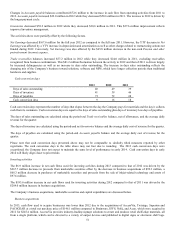
Revenue by Geography
The following table provides a breakdown of the Company’s revenue by geography:
(Dollars in millions) 2013 % of Total 2012 % of Total % Change 2012 2011
% of Total % Change
United States $ 1,576.8 43 % $ 1,695.5 45 % (7) % $ 1,695.5 $ 1,755.4 42 % (3) %
EMEA (Europe, the
Middle East & Africa) 1,353.5 37 % 1,320.3 35 % 3 % 1,320.3 1,531.6 37 % (14) %
Other International 737.3 20 % 781.8 20 % (6) % 781.8 886.0 21 % (12) %
Total revenue $ 3,667.6 100 % $ 3,797.6 100 % (3) % $ 3,797.6 $ 4,173.0 100 % (9) %
For the year ended December 31, 2013, the decline in revenues compared to the same period in 2012, for all regions, principally
reflects the impact of the Company’s planned exit from inkjet technologies partially offset by revenue growth principally in EMEA.
For 2013 currency exchange rates had a negligible YTY impact on revenue. For 2012 currency exchange rates had a 3% unfavorable
YTY impact on revenue.
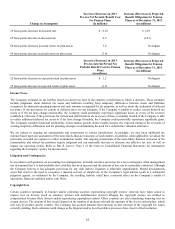
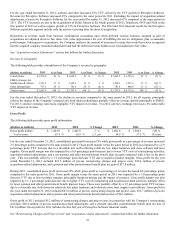
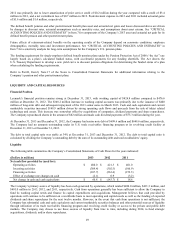
Gross Profit
The following table provides gross profit information:
(Dollars in millions) 2013 2012 % Change 2012 2011 % Change
Gross profit dollars $ 1,443.9 $ 1,401.8 3 % $ 1,401.8 $ 1,564.1 (10) %
% of revenue 39.4 % 36.9 % 2.5 pts 36.9 % 37.5 % (0.6) pts
For the year ended December 31, 2013, consolidated gross profit increased 3% while gross profit as a percentage of revenue increased
2.5 percentage points compared to the same period in 2012. Gross profit margin versus the same period in 2012 was impacted by a 2.9
percentage point YTY increase due to a favorable mix shift reflecting relatively less inkjet hardware and more software and laser
supplies. Gross profit margin was also impacted by a 0.8 percentage point increase due to lower YTY costs of restructuring activities,
acquisition-related adjustments, and a net pension and other post-retirement benefit plan net gain compared with a loss in the prior
year. This was partially offset by a 1.2 percentage point decrease YTY due to negative product margins. Gross profit for the year
ended December 31, 2013 included $21.5 million of pre-tax restructuring charges and project costs, $52.4 million of pre-tax
acquisition-related adjustments, and a pension and other postretirement benefit plan net gain of $17.4 million.
During 2012, consolidated gross profit decreased 10% while gross profit as a percentage of revenue decreased 0.6 percentage points
compared to the same period in 2011. Gross profit margin versus the same period in 2011 was impacted by a 3.0 percentage point
decrease YTY due to lower product margins, principally hardware pricing and the impact of currency. Gross profit margin was also
impacted by a 1.1 percentage point decrease due to higher YTY cost of restructuring and acquisition-related activities, partially offset
by lower pension and other postretirement benefit plan net losses. These were partially offset by a 3.5 percentage point YTY increase
due to a favorable mix shift driven by relatively less inkjet hardware and relatively more laser supplies and software. Gross profit for
the year ended December 31, 2012 included $47.8 million of pre-tax restructuring charges and project costs, $32.7 million of pre-tax
acquisition-related adjustments and a pension and other postretirement benefit plan net loss of $4.3 million.
Gross profit in 2011 included $5.2 million of restructuring charges and project costs in connection with the Company’s restructuring
activities, $20.4 million of pre-tax acquisition-related adjustments, and a pension and other postretirement benefit plan net loss of
$21.0 million. Gross profit for 2011 includes the first full year of Perceptive Software financial results.
See “Restructuring Charges and Project Costs” and “Acquisition-related Adjustments” sections that follow for further discussion.
41