Lexmark 2013 Annual Report Download - page 103
Download and view the complete annual report
Please find page 103 of the 2013 Lexmark annual report below. You can navigate through the pages in the report by either clicking on the pages listed below, or by using the keyword search tool below to find specific information within the annual report.-
 1
1 -
2
-
3
-
4
-
5
-
6
-
7
-
8
-
9
-
10
-
11
-
12
-
13
-
14
-
15
-
16
-
17
-
18
-
19
-
20
-
21
-
22
-
23
-
24
-
25
-
26
-
27
-
28
-
29
-
30
-
31
-
32
-
33
-
34
-
35
-
36
-
37
-
38
-
39
-
40
-
41
-
42
-
43
-
44
-
45
-
46
-
47
-
48
-
49
-
50
-
51
-
52
-
53
-
54
-
55
-
56
-
57
-
58
-
59
-
60
-
61
-
62
-
63
-
64
-
65
-
66
-
67
-
68
-
69
-
70
-
71
-
72
-
73
-
74
-
75
-
76
-
77
-
78
-
79
-
80
-
81
-
82
-
83
-
84
-
85
-
86
-
87
-
88
-
89
-
90
-
91
-
92
-
 93
93 -
 94
94 -
 95
95 -
 96
96 -
 97
97 -
 98
98 -
 99
99 -
 100
100 -
 101
101 -
 102
102 -
 103
103 -
 104
104 -
 105
105 -
 106
106 -
 107
107 -
 108
108 -
 109
109 -
 110
110 -
 111
111 -
 112
112 -
 113
113 -
114
-
115
-
116
-
117
-
118
-
119
-
120
-
121
-
122
-
123
-
124
-
125
-
126
-
127
-
128
-
129
-
130
-
131
-
132
-
133
-
134
-
135
-
136
-
137
-
138
-
139
-
140
-
141
-
142
-
143
-
144
-
145
-
146
-
147
-
148
-
149
-
150
-
151
-
152
 |
 |

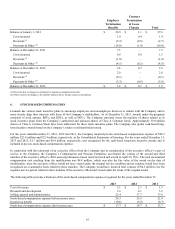
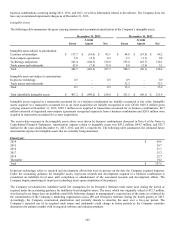
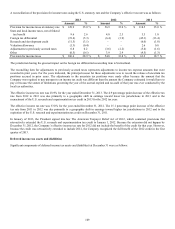
A summary of the status of the Company’s RSU and DSU grants as of December 31, 2013 and the changes during the year is
presented below:
Units
(In Millions)
Weighted
Average
Grant Date
Fair Value
(Per Share)
Weighted
Average
Remaining
Contractual Life
(Years)
Aggregate
Intrinsic
Value (In
Millions)
RSUs and DSUs at December 31, 2012 2.5 $ 34.85 1.7 $ 57.4
Granted 1.3 23.26
Vested (0.8) 32.00
Forfeited or canceled (0.2) 32.05
RSUs and DSUs at December 31, 2013 2.8 $ 30.71 1.6 $ 100.5
For the year ended December 31, 2013, the total fair value of RSUs and DSUs that vested was $19.6 million. As of December 31,
2013, the Company had $37.0 million of total unrecognized compensation expense, net of estimated forfeitures, related to RSUs and
DSUs that will be recognized over the weighted average period of 2.3 years.
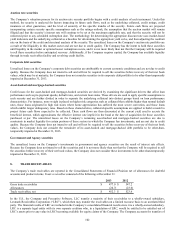
7. MARKETABLE SECURITIES
The Company evaluates its marketable securities in accordance with authoritative guidance on accounting for investments in debt and
equity securities, and has determined that all of its investments in marketable securities should be classified as available-for-sale and
reported at fair value, with unrealized gains and losses recorded in Accumulated other comprehensive loss on the Consolidated
Statements of Financial Position. The fair values of the Company’s available-for-sale marketable securities are based on quoted
market prices or other observable market data, discount cash flow analyses, or in some cases, the Company’s amortized cost which
approximates fair value.
Money market funds included in Cash and cash equivalents on the Consolidated Statements of Financial Position are excluded from
the information contained in this Note. Refer to Note 3 of the Notes to Consolidated Financial Statements for information regarding
these investments.
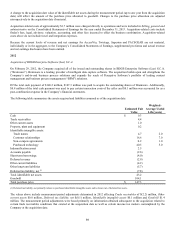
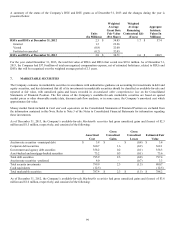
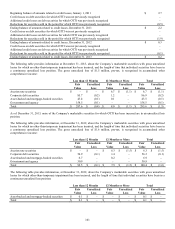
As of December 31, 2013, the Company’s available-for-sale Marketable securities had gross unrealized gains and (losses) of $2.3
million and $1.5 million, respectively, and consisted of the following:
Gross Gross
Amortized Unrealized Unrealized Estimated Fair
Cost Gains Losses Value
Auction rate securities - municipal debt $ 3.8 $ – $ (0.4) $ 3.4
Corporate debt securities 360.7 1.6 (0.2) 362.1
Government and agency debt securities 358.2 0.2 (0.1) 358.3
Asset-backed and mortgage-backed securities 73.2 0.5 (0.1) 73.6
Total debt securities 795.9 2.3 (0.8) 797.4
Auction rate securities - preferred 4.0 – (0.7) 3.3
Total security investments 799.9 2.3 (1.5) 800.7
Cash equivalents (12.5) – – (12.5)
Total marketable securities $ 787.4 $ 2.3 $ (1.5) $ 788.2
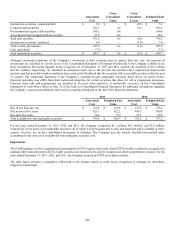
As of December 31, 2012, the Company’s available-for-sale Marketable securities had gross unrealized gains and (losses) of $3.6
million and $1.6 million, respectively, and consisted of the following:
99