Lexmark 2013 Annual Report Download - page 46
Download and view the complete annual report
Please find page 46 of the 2013 Lexmark annual report below. You can navigate through the pages in the report by either clicking on the pages listed below, or by using the keyword search tool below to find specific information within the annual report.-
 1
1 -
2
-
3
-
4
-
5
-
6
-
7
-
8
-
9
-
10
-
11
-
12
-
13
-
14
-
15
-
16
-
17
-
18
-
19
-
20
-
21
-
22
-
23
-
24
-
25
-
26
-
27
-
28
-
29
-
30
-
31
-
32
-
33
-
34
-
35
-
 36
36 -
 37
37 -
 38
38 -
 39
39 -
 40
40 -
 41
41 -
 42
42 -
 43
43 -
 44
44 -
 45
45 -
 46
46 -
 47
47 -
 48
48 -
 49
49 -
 50
50 -
 51
51 -
 52
52 -
 53
53 -
 54
54 -
 55
55 -
 56
56 -
57
-
58
-
59
-
60
-
61
-
62
-
63
-
64
-
65
-
66
-
67
-
68
-
69
-
70
-
71
-
72
-
73
-
74
-
75
-
76
-
77
-
78
-
79
-
80
-
81
-
82
-
83
-
84
-
85
-
86
-
87
-
88
-
89
-
90
-
91
-
92
-
93
-
94
-
95
-
96
-
97
-
98
-
99
-
100
-
101
-
102
-
103
-
104
-
105
-
106
-
107
-
108
-
109
-
110
-
111
-
112
-
113
-
114
-
115
-
116
-
117
-
118
-
119
-
120
-
121
-
122
-
123
-
124
-
125
-
126
-
127
-
128
-
129
-
130
-
131
-
132
-
133
-
134
-
135
-
136
-
137
-
138
-
139
-
140
-
141
-
142
-
143
-
144
-
145
-
146
-
147
-
148
-
149
-
150
-
151
-
152
 |
 |

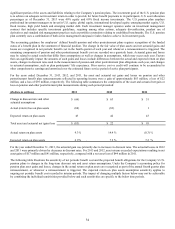
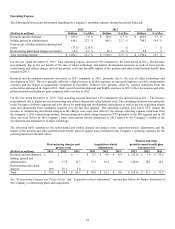
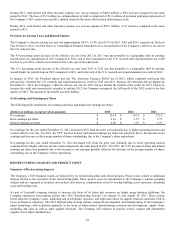
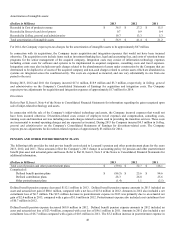
Operating Expense
The following table presents information regarding the Company’s operating expenses during the periods indicated:
2013 2012 2011
(Dollars in millions) Dollars % of Rev Dollars % of Rev Dollars % of Rev
Research and development $ 287.2 7.8 % $369.1 9.7 % $ 405.9 9.7 %
Selling, general & administrative 810.1 22.1 % 805.1 21.2 % 788.5 18.9 %
Gain on sale of inkjet-related technology and
assets (73.5) (2.0) % – – % – – %
Restructuring and related charges (reversals) 10.9 0.3 % 36.1 1.0 % 2.0 – %
Total operating expense $ 1,034.7 28.2 % $ 1,210.3 31.9 % $ 1,196.4 28.7 %
For the year ended December 31, 2013, Total operating expense decreased 15% compared to the same period in 2012. The decrease
was primarily due to the net benefit of the sale of inkjet technology and related development resources as well as lower pre-tax
restructuring and related charges and related project costs and favorable impact of the pension and other postretirement benefit plan
net gain in 2013.
Research and development expenses decreased in 2013 compared to 2012, primarily due to the exit of inkjet technology and
development in 2012. This was partially offset by a slight increase in SG&A expenses as increased employee variable compensation
expenses and the impact of acquisitions completed in Perceptive Software were partially offset by expense reductions from the
restructuring announced in August 2012. Both research and development and SG&A expenses in 2013 reflect the pension and other
postretirement benefit plan net gain compared with a net loss in 2012.
For the year ended December 31, 2012, Total operating expense increased 1.2% compared to the same period in 2011. The increase
was primarily due to higher pre-tax restructuring and related charges and related project costs. The remaining increases were primarily
in the Perceptive Software segment and were driven by marketing and development expenditures as well as pre-tax acquisition related
costs and adjustments from companies acquired over the last four quarters. ISS operating expenses were lower YTY despite the
increase in restructuring and related charges as the charges were more than offset by the savings reflecting expense reductions from
the Company’s 2012 restructuring actions. Restructuring and related charges increased YTY primarily in the ISS segment and in All
other and were driven by the Company’s latest restructuring actions announced in 2012 related to the Company’s exiting of the
development and manufacture of inkjet technology.
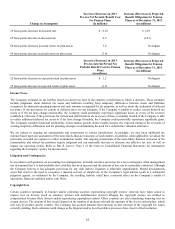
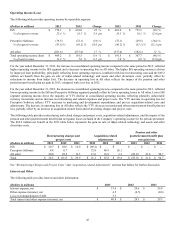
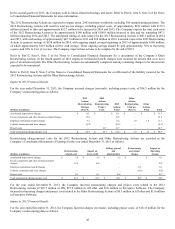
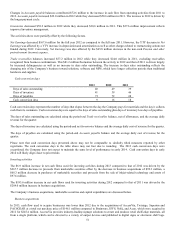
The following table summarizes the restructuring and related charges and project costs, acquisition-related adjustments, and the
impact of the pension and other postretirement benefit plan net (gains) losses included in the Company’s operating expenses for the
periods presented in the table above:
Pension and other
Restructuring charges and Acquisition-related postretirement benefit plan
project costs adjustments net (gain) loss
(
Dollars in millions
)
2013 2012 2011 2013 2012 2011 2013 2012 2011
Research and develo
p
men
t
$
–
$
–
$
–
$ 0.7 $ 0.9 $ 0.4 $
(
36.0
)
$7.4$39.6
Selling, general and
administrative 22.1 37.9 22.7 37.3 32.2 8.6 (29.6) 10.1 34.1
Restructuring and related
charges 10.9 36.1 2.0 – – – – – –
Total $ 33.0 $ 74.0 $ 24.7 $ 38.0 $ 33.1 $ 9.0 $ (65.6) $ 17.5 $ 73.7
See “Restructuring Charges and Project Costs” and “Acquisition-related Adjustments” sections that follow for further discussion of
the Company’s restructuring plans and acquisitions.
42