Lexmark 2013 Annual Report Download - page 104
Download and view the complete annual report
Please find page 104 of the 2013 Lexmark annual report below. You can navigate through the pages in the report by either clicking on the pages listed below, or by using the keyword search tool below to find specific information within the annual report.-
 1
1 -
2
-
3
-
4
-
5
-
6
-
7
-
8
-
9
-
10
-
11
-
12
-
13
-
14
-
15
-
16
-
17
-
18
-
19
-
20
-
21
-
22
-
23
-
24
-
25
-
26
-
27
-
28
-
29
-
30
-
31
-
32
-
33
-
34
-
35
-
36
-
37
-
38
-
39
-
40
-
41
-
42
-
43
-
44
-
45
-
46
-
47
-
48
-
49
-
50
-
51
-
52
-
53
-
54
-
55
-
56
-
57
-
58
-
59
-
60
-
61
-
62
-
63
-
64
-
65
-
66
-
67
-
68
-
69
-
70
-
71
-
72
-
73
-
74
-
75
-
76
-
77
-
78
-
79
-
80
-
81
-
82
-
83
-
84
-
85
-
86
-
87
-
88
-
89
-
90
-
91
-
92
-
93
-
 94
94 -
 95
95 -
 96
96 -
 97
97 -
 98
98 -
 99
99 -
 100
100 -
 101
101 -
 102
102 -
 103
103 -
 104
104 -
 105
105 -
 106
106 -
 107
107 -
 108
108 -
 109
109 -
 110
110 -
 111
111 -
 112
112 -
 113
113 -
 114
114 -
115
-
116
-
117
-
118
-
119
-
120
-
121
-
122
-
123
-
124
-
125
-
126
-
127
-
128
-
129
-
130
-
131
-
132
-
133
-
134
-
135
-
136
-
137
-
138
-
139
-
140
-
141
-
142
-
143
-
144
-
145
-
146
-
147
-
148
-
149
-
150
-
151
-
152
 |
 |

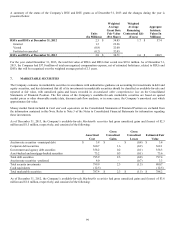
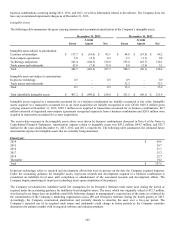
Gross Gross
Amortized Unrealized Unrealized Estimated Fair
Cost Gains Losses Value
Auction rate securities - municipal debt $ 3.8 $ – $ (0.5) $ 3.3
Corporate debt securities 301.3 2.4 (0.1) 303.6
Government and agency debt securities 340.2 0.6 – 340.8
Asset-backed and mortgage-backed securities 55.9 0.6 – 56.5
Total debt securities 701.2 3.6 (0.6) 704.2
Auction rate securities - preferred 4.0 – (1.0) 3.0
Total security investments 705.2 3.6 (1.6) 707.2
Cash equivalents (7.5) – – (7.5)
Total marketable securities $ 697.7 $ 3.6 $ (1.6) $ 699.7
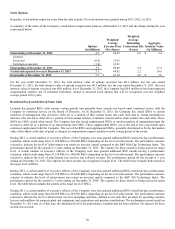
Although contractual maturities of the Company’s investment in debt securities may be greater than one year, the majority of
investments are classified as Current assets in the Consolidated Statements of Financial Position due to the Company’s ability to use
these investments for current liquidity needs if required. As of December 31, 2013 and 2012, auction rate securities of $6.7 million
and $6.3 million, respectively, are classified in noncurrent assets due to the fact that the securities have experienced unsuccessful
auctions and that poor debt market conditions have reduced the likelihood that the securities will successfully auction within the next
12 months. The contractual maturities of the Company’s available-for-sale marketable securities noted above are shown below.
Expected maturities may differ from final contractual maturities for certain securities that allow for call or prepayment provisions.
Proceeds from calls and prepayments are included in Proceeds from maturities of marketable securities on the Consolidated
Statements of Cash Flows. Refer to Note 21 of the Notes to Consolidated Financial Statements for additional information regarding
the Company’s auction rate preferred stock activity occurring subsequent to the date of the financial statements.
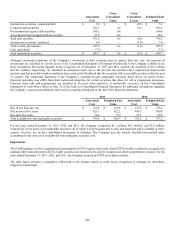
2013 2012
Amortized Estimated Fair Amortized Estimated Fair
Cost Value Cost Value
Due in less than one year $ 160.4 $ 160.6 $ 185.4 $ 185.8
Due in one to five years 621.1 622.2 498.3 500.9
Due after five years 18.4 17.9 21.5 20.5
Total available-for-sale marketable securities $ 799.9 $ 800.7 $ 705.2 $ 707.2
For the years ended December 31, 2013, 2012, and 2011, the Company recognized $1.3 million, $4.2 million, and $3.2 million,
respectively, in net gains on its marketable securities; all of which is realized gains due to sales and maturities and is included in Other
expense (income), net on the Consolidated Statements of Earnings. The Company uses the specific identification method when
accounting for the costs of its available-for-sale marketable securities sold.
Impairment
The FASB guidance on the recognition and presentation of OTTI requires that credit related OTTI on debt securities be recognized in
earnings while noncredit related OTTI of debt securities not expected to be sold be recognized in other comprehensive income. For the
years ended December 31, 2013, 2012, and 2011, the Company incurred no OTTI on its debt securities.
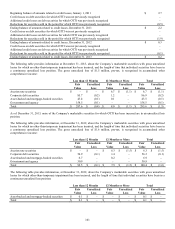
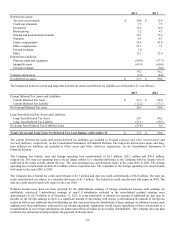
The table below presents a cumulative rollforward of the amount related to credit losses recognized in earnings for other-than-
temporary impairments:
100