Lexmark 2013 Annual Report Download - page 122
Download and view the complete annual report
Please find page 122 of the 2013 Lexmark annual report below. You can navigate through the pages in the report by either clicking on the pages listed below, or by using the keyword search tool below to find specific information within the annual report.-
 1
1 -
2
-
3
-
4
-
5
-
6
-
7
-
8
-
9
-
10
-
11
-
12
-
13
-
14
-
15
-
16
-
17
-
18
-
19
-
20
-
21
-
22
-
23
-
24
-
25
-
26
-
27
-
28
-
29
-
30
-
31
-
32
-
33
-
34
-
35
-
36
-
37
-
38
-
39
-
40
-
41
-
42
-
43
-
44
-
45
-
46
-
47
-
48
-
49
-
50
-
51
-
52
-
53
-
54
-
55
-
56
-
57
-
58
-
59
-
60
-
61
-
62
-
63
-
64
-
65
-
66
-
67
-
68
-
69
-
70
-
71
-
72
-
73
-
74
-
75
-
76
-
77
-
78
-
79
-
80
-
81
-
82
-
83
-
84
-
85
-
86
-
87
-
88
-
89
-
90
-
91
-
92
-
93
-
94
-
95
-
96
-
97
-
98
-
99
-
100
-
101
-
102
-
103
-
104
-
105
-
106
-
107
-
108
-
109
-
110
-
111
-
 112
112 -
 113
113 -
 114
114 -
 115
115 -
 116
116 -
 117
117 -
 118
118 -
 119
119 -
 120
120 -
 121
121 -
 122
122 -
 123
123 -
 124
124 -
 125
125 -
 126
126 -
 127
127 -
 128
128 -
 129
129 -
 130
130 -
 131
131 -
 132
132 -
133
-
134
-
135
-
136
-
137
-
138
-
139
-
140
-
141
-
142
-
143
-
144
-
145
-
146
-
147
-
148
-
149
-
150
-
151
-
152
 |
 |

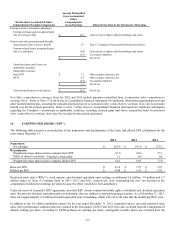
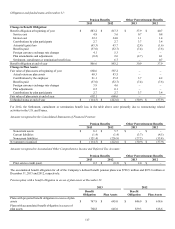
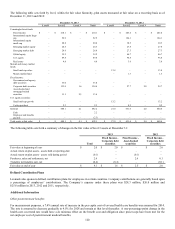
Components of net periodic benefit cost:
Pension Benefits Other Postretirement Benefits
2013 2012 2011 2013 2012 2011
Net Periodic Benefit Cost:
Service cost $ 4.8 $ 3.6 $ 3.2 $ 0.7 $ 0.8 $ 0.9
Interest cost 32.3 34.0 38.6 1.1 1.4 1.8
Expected return on plan assets (43.0) (42.1) (43.0) – – –
Amortization of prior service cost (credit) – – – (0.8) (0.2) (3.4)
Immediate recognition of net (gain) loss (80.6) 23.4 96.1 (2.4) (1.6) (1.4)
Settlement, curtailment or termination benefit loss
(gain) – 6.7 (0.3) – 0.7 –
Net periodic benefit cost $ (86.5) $ 25.6 $ 94.6 $ (1.4) $ 1.1 $ (2.1)
The Settlement, curtailment or termination benefit losses totaling $7.4 million in 2012 are the net result of restructuring losses in the
U.S. of $7.9 million and a curtailment gain in France of $0.5 million.
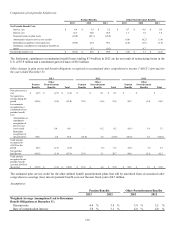
Other changes in plan assets and benefit obligations recognized in accumulated other comprehensive income (“AOCI”) (pre-tax) for
the years ended December 31:
2013 2012 2011
Pension
Benefits
Other
Postretirement
Benefits Total
Pension
Benefits
Other
Postretirement
Benefits Total
Pension
Benefits
Other
Postretirement
Benefits Total
New prior service
cost $ (0.7) $ (2.7) $ (3.4) $ – $ 0.1 $ 0.1 $ – $ – $ –
Net (gain) loss
arising during the
period (80.6) (2.4) (83.0) 23.4 (1.6) 21.8 96.2 (1.4) 94.8
Less amounts
recognized as a
component of net
periodic benefit
cost:
Amortization or
curtailment
recognition of
prior service
(cost) credit – 0.8 0.8 – 0.2 0.2 (0.1) 3.4 3.3
Immediate
recognition of
net gain (loss) 80.6 2.4 83.0 (23.4) 1.6 (21.8) (96.2) 1.4 (94.8)
Total amount
recognized in
AOCI for the
period (0.7) (1.9) (2.6) – 0.3 0.3 (0.1) 3.4 3.3
Net periodic
benefit cost (86.5) (1.4) (87.9) 25.6 1.1 26.7 94.6 (2.1) 92.5
Total amount
recognized in net
periodic benefit
cost and AOCI for
the period $ (87.2) $ (3.3) $ (90.5) $ 25.6 $ 1.4 $ 27.0 $ 94.5 $ 1.3 $ 95.8
The estimated prior service credit for the other defined benefit postretirement plans that will be amortized from Accumulated other
comprehensive earnings (loss) into net periodic benefit cost over the next fiscal year is $0.7 million.
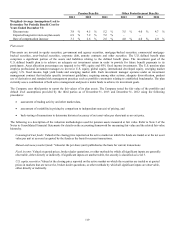
Assumptions:
Pension Benefits Other Postretirement Benefits
2013 2012 2013 2012
Weighted-Average Assumptions Used to Determine
Benefit Obligations at December 31:
Discount rate 4.6 % 3.9 % 3.9 % 3.5 %
Rate of compensation increase 3.0 % 3.1 % 4.0 % 4.0 %
118