Lexmark 2013 Annual Report Download - page 54
Download and view the complete annual report
Please find page 54 of the 2013 Lexmark annual report below. You can navigate through the pages in the report by either clicking on the pages listed below, or by using the keyword search tool below to find specific information within the annual report.-
 1
1 -
2
-
3
-
4
-
5
-
6
-
7
-
8
-
9
-
10
-
11
-
12
-
13
-
14
-
15
-
16
-
17
-
18
-
19
-
20
-
21
-
22
-
23
-
24
-
25
-
26
-
27
-
28
-
29
-
30
-
31
-
32
-
33
-
34
-
35
-
36
-
37
-
38
-
39
-
40
-
41
-
42
-
43
-
 44
44 -
 45
45 -
 46
46 -
 47
47 -
 48
48 -
 49
49 -
 50
50 -
 51
51 -
 52
52 -
 53
53 -
 54
54 -
 55
55 -
 56
56 -
 57
57 -
 58
58 -
 59
59 -
 60
60 -
 61
61 -
 62
62 -
 63
63 -
 64
64 -
65
-
66
-
67
-
68
-
69
-
70
-
71
-
72
-
73
-
74
-
75
-
76
-
77
-
78
-
79
-
80
-
81
-
82
-
83
-
84
-
85
-
86
-
87
-
88
-
89
-
90
-
91
-
92
-
93
-
94
-
95
-
96
-
97
-
98
-
99
-
100
-
101
-
102
-
103
-
104
-
105
-
106
-
107
-
108
-
109
-
110
-
111
-
112
-
113
-
114
-
115
-
116
-
117
-
118
-
119
-
120
-
121
-
122
-
123
-
124
-
125
-
126
-
127
-
128
-
129
-
130
-
131
-
132
-
133
-
134
-
135
-
136
-
137
-
138
-
139
-
140
-
141
-
142
-
143
-
144
-
145
-
146
-
147
-
148
-
149
-
150
-
151
-
152
 |
 |

50
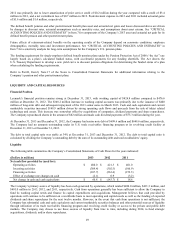
As of December 31, 2013, the Company held $1,054.7 million in Cash and cash equivalents and current Marketable securities. The
Company’s ability to fund operations from this balance could be limited by the liquidity in the market as well as possible tax
implications of moving proceeds across jurisdictions. Of this amount, approximately $1,014.5 million of Cash and cash equivalents
and current Marketable securities were held by foreign subsidiaries. The Company utilizes a variety of financing strategies with the
objective of having its worldwide cash available in the locations where it is needed. However, if amounts held by foreign subsidiaries
were needed to fund operations in the U.S., the Company could be required to accrue and pay taxes to repatriate a large portion of
these funds. The Company’s intent is to permanently reinvest undistributed earnings of low tax rate foreign subsidiaries and current
plans do not demonstrate a need to repatriate them to fund operations in the U.S.
As of December 31, 2012, the Company held $905.8 million in Cash and cash equivalents and current Marketable securities. Of this
amount, approximately $869.8 million of Cash and cash equivalents and current Marketable securities were held by foreign
subsidiaries.
A discussion of the Company’s additional sources of liquidity is included in the Financing activities section to follow.
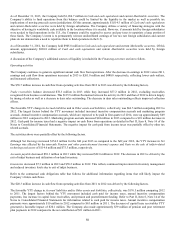
Operating activities
The Company continues to generate significant annual cash flow from operations. After the decrease in earnings in 2012 versus 2011,
earnings and cash flow from operations increased in 2013 to $261.8 million and $480.0 respectively, reflecting lower cash outlays,
and increased collections.
The $58.7 million increase in cash flow from operating activities from 2012 to 2013 was driven by the following factors.
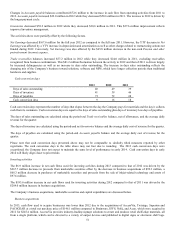
Trade receivables balance decreased $78.3 million in 2013 while they increased $57.2 million in 2012, excluding receivables
recognized from business combinations. This $135.5 million fluctuation between the activity in 2013 and that of 2012 is driven largely
by timing of sales as well as a decrease in days sales outstanding. The decrease in days sales outstanding reflects improved collection
efforts.
The favorable YTY change in Accrued liabilities and in Other assets and liabilities, collectively, was $66.5 million comparing 2013 to
2012. The largest factors behind the YTY movement included increased incentive compensation accruals and marketing program
accruals. Annual incentive compensation accruals, which are expected to be paid in first quarter of 2014, were up approximately $49
million in 2013 compared to 2012. Marketing program accruals increased $24 million in 2013 compared to a $10 million decrease in
2012. Cash paid for income taxes had a negative impact on cash flows from operations as detailed in Part II, Item 8, Note 14 of the
Notes to Consolidated Financial Statements. The negative impact for cash paid from income taxes was partially offset by other tax
related accruals.
The activities above were partially offset by the following factors.
Although Net Earnings increased $154.2 million for the full year 2013 as compared to the full year 2012, the YTY increase in Net
Earnings was affected by the non-cash Pension and other postretirement (income) expense and Gain on the sale of inkjet-related
technology and assets of $114.6 million and $75.3 million, respectively.
Accounts payable decreased $38.3 million in 2013 while they increased $22.0 million in 2012. The decrease in 2013 is driven by the
exit of inkjet business and utilization of on-hand inventory.
Inventories decreased $7.3 million in 2013 and $58.2 million in 2012. This reflects continued improvement in inventory management
and reduced inventory levels due to exit of inkjet business.
Refer to the contractual cash obligations table that follows for additional information regarding items that will likely impact the
Company’s future cash flows.
The $20.3 million increase in cash flow from operating activities from 2011 to 2012 was driven by the following factors.
The favorable YTY change in Accrued liabilities and in Other assets and liabilities, collectively, was $176.5 million comparing 2012
to 2011. The largest factors behind the YTY movement included cash paid for income taxes, annual incentive compensation
payments, less increase in capital lease receivables, and pension and postretirement funding. Refer to Part II, Item 8, Note 14 of the
Notes to Consolidated Financial Statements for information related to cash paid for income taxes. Annual incentive compensation
payments were approximately $10 million in 2012 compared to $65 million in 2011. The decrease of capital lease receivables YTY
generated a favorable impact of $20.1 million. The Company also made approximately $39 million of pension and post retirement
plan payments in 2012 compared to the net contribution of $31 million in 2011.
50