Lexmark 2013 Annual Report Download - page 132
Download and view the complete annual report
Please find page 132 of the 2013 Lexmark annual report below. You can navigate through the pages in the report by either clicking on the pages listed below, or by using the keyword search tool below to find specific information within the annual report.-
 1
1 -
2
-
3
-
4
-
5
-
6
-
7
-
8
-
9
-
10
-
11
-
12
-
13
-
14
-
15
-
16
-
17
-
18
-
19
-
20
-
21
-
22
-
23
-
24
-
25
-
26
-
27
-
28
-
29
-
30
-
31
-
32
-
33
-
34
-
35
-
36
-
37
-
38
-
39
-
40
-
41
-
42
-
43
-
44
-
45
-
46
-
47
-
48
-
49
-
50
-
51
-
52
-
53
-
54
-
55
-
56
-
57
-
58
-
59
-
60
-
61
-
62
-
63
-
64
-
65
-
66
-
67
-
68
-
69
-
70
-
71
-
72
-
73
-
74
-
75
-
76
-
77
-
78
-
79
-
80
-
81
-
82
-
83
-
84
-
85
-
86
-
87
-
88
-
89
-
90
-
91
-
92
-
93
-
94
-
95
-
96
-
97
-
98
-
99
-
100
-
101
-
102
-
103
-
104
-
105
-
106
-
107
-
108
-
109
-
110
-
111
-
112
-
113
-
114
-
115
-
116
-
117
-
118
-
119
-
120
-
121
-
 122
122 -
 123
123 -
 124
124 -
 125
125 -
 126
126 -
 127
127 -
 128
128 -
 129
129 -
 130
130 -
 131
131 -
 132
132 -
 133
133 -
 134
134 -
 135
135 -
 136
136 -
 137
137 -
 138
138 -
 139
139 -
 140
140 -
 141
141 -
 142
142 -
143
-
144
-
145
-
146
-
147
-
148
-
149
-
150
-
151
-
152
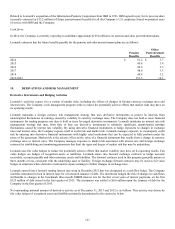
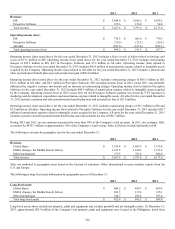
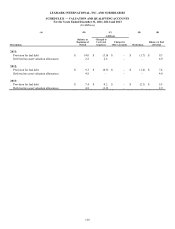
 |
 |

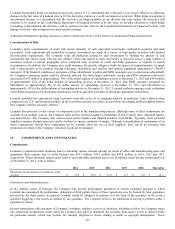
2013 2012 2011
Revenue:
ISS $ 3,444.0 $ 3,641.6 $ 4,078.2
Perceptive Software 223.6 156.0 94.8
Total revenue $ 3,667.6 $ 3,797.6 $ 4,173.0
Operating income (loss):
ISS $ 770.3 $ 601.0 $ 779.3
Perceptive Software (79.5) (72.1) (29.5)
All other (281.6) (337.4) (382.1)
Total operating income (loss) $ 409.2 $ 191.5 $ 367.7
Operating income (loss) noted above for the year ended December 31, 2013 includes a Gain on sale of inkjet-related technology and
assets of $73.5 million in ISS. Operating income (loss) noted above for the year ended December 31, 2013 includes restructuring
charges of $25.2 million in ISS, $4.7 in Perceptive Software, and $7.9 million in All other. Operating income (loss) related to
Perceptive Software for the year ended December 31, 2013 includes $56.4 million of amortization expense related to intangible assets
acquired by the Company. Operating income (loss) related to All other for the year ended December 31, 2013 includes a pension and
other postretirement benefit plan asset and actuarial net gain of $83.0 million.
Operating income (loss) noted above for the year ended December 31, 2012 includes restructuring charges of $85.5 million in ISS,
$19.1 million in All other, and $0.7 million in Perceptive Software. ISS operating income (loss) in 2012 versus 2011 was primarily
influenced by negative currency movements and an increase in restructuring charges. Operating income (loss) related to Perceptive
Software for the year ended December 31, 2012 includes $40.9 million of amortization expense related to intangible assets acquired
by the Company. Operating income (loss) in 2012 versus 2011 for the Perceptive Software segment was driven by YTY increases in
marketing and development expenditures and amortization expense related to intangible assets. All other for the year ended December
31, 2012 includes a pension and other postretirement benefit plan asset and actuarial net loss of $21.8 million.
Operating income (loss) noted above for the year ended December 31, 2011 includes restructuring charges of $9.7 million in ISS and
$3.8 million in All other. Operating income (loss) related to Perceptive Software for the year ended December 31, 2011 includes $20.7
million of amortization expense related to intangible assets acquired by the Company. All other for the year ended December 31, 2011
includes a pension and other postretirement benefit plan asset and actuarial net loss of $94.7 million.
During 2013 and 2012, no one customer accounted for more than 10% of the Company’s total revenues. In 2011, one customer, Dell,
accounted for $414.7 million or approximately 10% of the Company’s total revenue. Sales to Dell are included primarily in ISS.
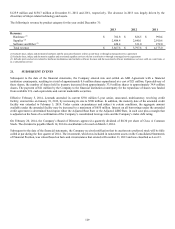
The following is revenue by geographic area for the year ended December 31:
2013 2012 2011
Revenue:
United States $ 1,576.8 $ 1,695.5 $ 1,755.4
EMEA (Europe, the Middle East & Africa) 1,353.5 1,320.3 1,531.6
Other International 737.3 781.8 886.0
Total revenue $ 3,667.6 $ 3,797.6 $ 4,173.0
Sales are attributed to geographic areas based on the location of customers. Other International revenue includes exports from the
U.S. and Europe.
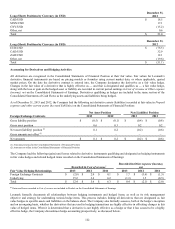
The following is long-lived asset information by geographic area as of December 31:
2013 2012 2011
Long-lived assets:
United States $ 466.2 $ 445.3 $ 460.3
EMEA (Europe, the Middle East & Africa) 101.5 117.4 125.1
Other International 244.7 282.6 303.4
Total long-lived assets $ 812.4 $ 845.3 $ 888.8
Long-lived assets above include net property, plant and equipment and exclude goodwill and net intangible assets. At December 31,
2013, approximately $83.9 million of the Company’s net property, plant and equipment were located in the Philippines, down from
128